Paper Sharing
【International Papers】Synchrotron-radiation x-ray topography and reticulography of bulk β Ga₂O₃ crystals grown by the cold crucible method
日期:2026-05-28阅读:147
Researchers from Mie University, Japan Fine Ceramics Center, C&A Corporation, Tohoku University have published a dissertation titled "Synchrotron-radiation x-ray topography and reticulography of bulk β‑Ga₂O₃ crystals grown by the cold crucible method" in Journal of Applied Physics.
Background
β‑Ga₂O₃ is a promising ultra-wide-bandgap semiconductor for next-generation high-power and high-temperature electronics due to its ~4.8–4.9 eV bandgap and breakdown field above 8 MV/cm. The structural quality of bulk substrates critically determines device performance and reliability. Traditional melt growth methods including EFG, CZ, and VB require expensive noble-metal crucibles, leading to high cost and inevitable metal contamination as well as characteristic defects. The cold crucible (OCCC) method enables low-cost and low-contamination growth without noble-metal crucibles and allows high oxygen partial pressure. However, the defect features, spatial distribution, lattice misorientation, and their correlation with growth morphology in OCCC-grown β‑Ga₂O₃ remain largely unexplored, and the defect evolution mechanism is still unclear.
Abstract
The structural properties of a β‑Ga₂O₃ single crystal grown by the oxide crystal growth from cold crucible (OCCC) method were investigated using synchrotron radiation x‑ray topography and x‑ray reticulography. The region grown beneath the seed exhibits high crystalline quality with a rocking curve full width at half maximum of about 26 arc sec. During diameter enlargement, a twist-type lattice misorientation develops between the central and laterally expanded regions, originating near the shoulder and propagating along boundaries parallel to the 〈010〉 growth direction. Dislocation analysis reveals that 〈010〉-oriented screw dislocations dominate the defect structure with densities of ~ 10⁵ cm⁻², while higher densities (~ 10⁶ cm⁻²) appear in the wing region (i.e., the laterally expanded region formed during diameter enlargement). These results clarify defect formation in OCCC-grown β‑Ga₂O₃ and provide insights into optimizing growth conditions.
Highlights
First systematic characterization of structural defects in OCCC-grown bulk β‑Ga₂O₃ using synchrotron radiation x-ray topography and reticulography.
Revealing twist-type lattice misorientation along 〈010〉 and its domain boundary evolution during diameter enlargement.
Identifying the dominant 〈010〉 screw dislocation type and its spatial distribution in β‑Ga₂O₃.
Comparing crystallinity between high-quality central region and high-defect wing region, indicating optimization direction for OCCC method.
Conclusion
In this study, the structural properties and defect structure of a β‑Ga₂O₃ single crystal grown by the OCCC method were systematically investigated using SR-XRT and x‑ray reticulography. These techniques enabled nondestructive visualization of lattice distortions, domain boundaries, and dislocations over large areas with high spatial and angular sensitivity.
The region grown directly beneath the seed exhibited highly uniform diffraction contrast and excellent crystalline quality. Rocking curves reconstructed from ω‑rocking x‑ray diffraction imaging showed a FWHM of approximately 26 arc sec, which is comparable to values reported for commercial melt‑grown β‑Ga₂O₃ substrates. However, during diameter enlargement, a twist‑type lattice misorientation developed between the central region and the laterally expanded portion of the crystal. Reticulography measurements revealed that this misorientation originates near the shoulder region and propagates downward along domain boundaries roughly parallel to the 〈010〉 growth direction. The magnitude of the misorientation across these boundaries was estimated to be on the order of 10⁻⁶–10⁻⁵ rad, which should be regarded as the total local lattice misorientation, including contributions from both lattice plane curvature and defect‑related distortions.
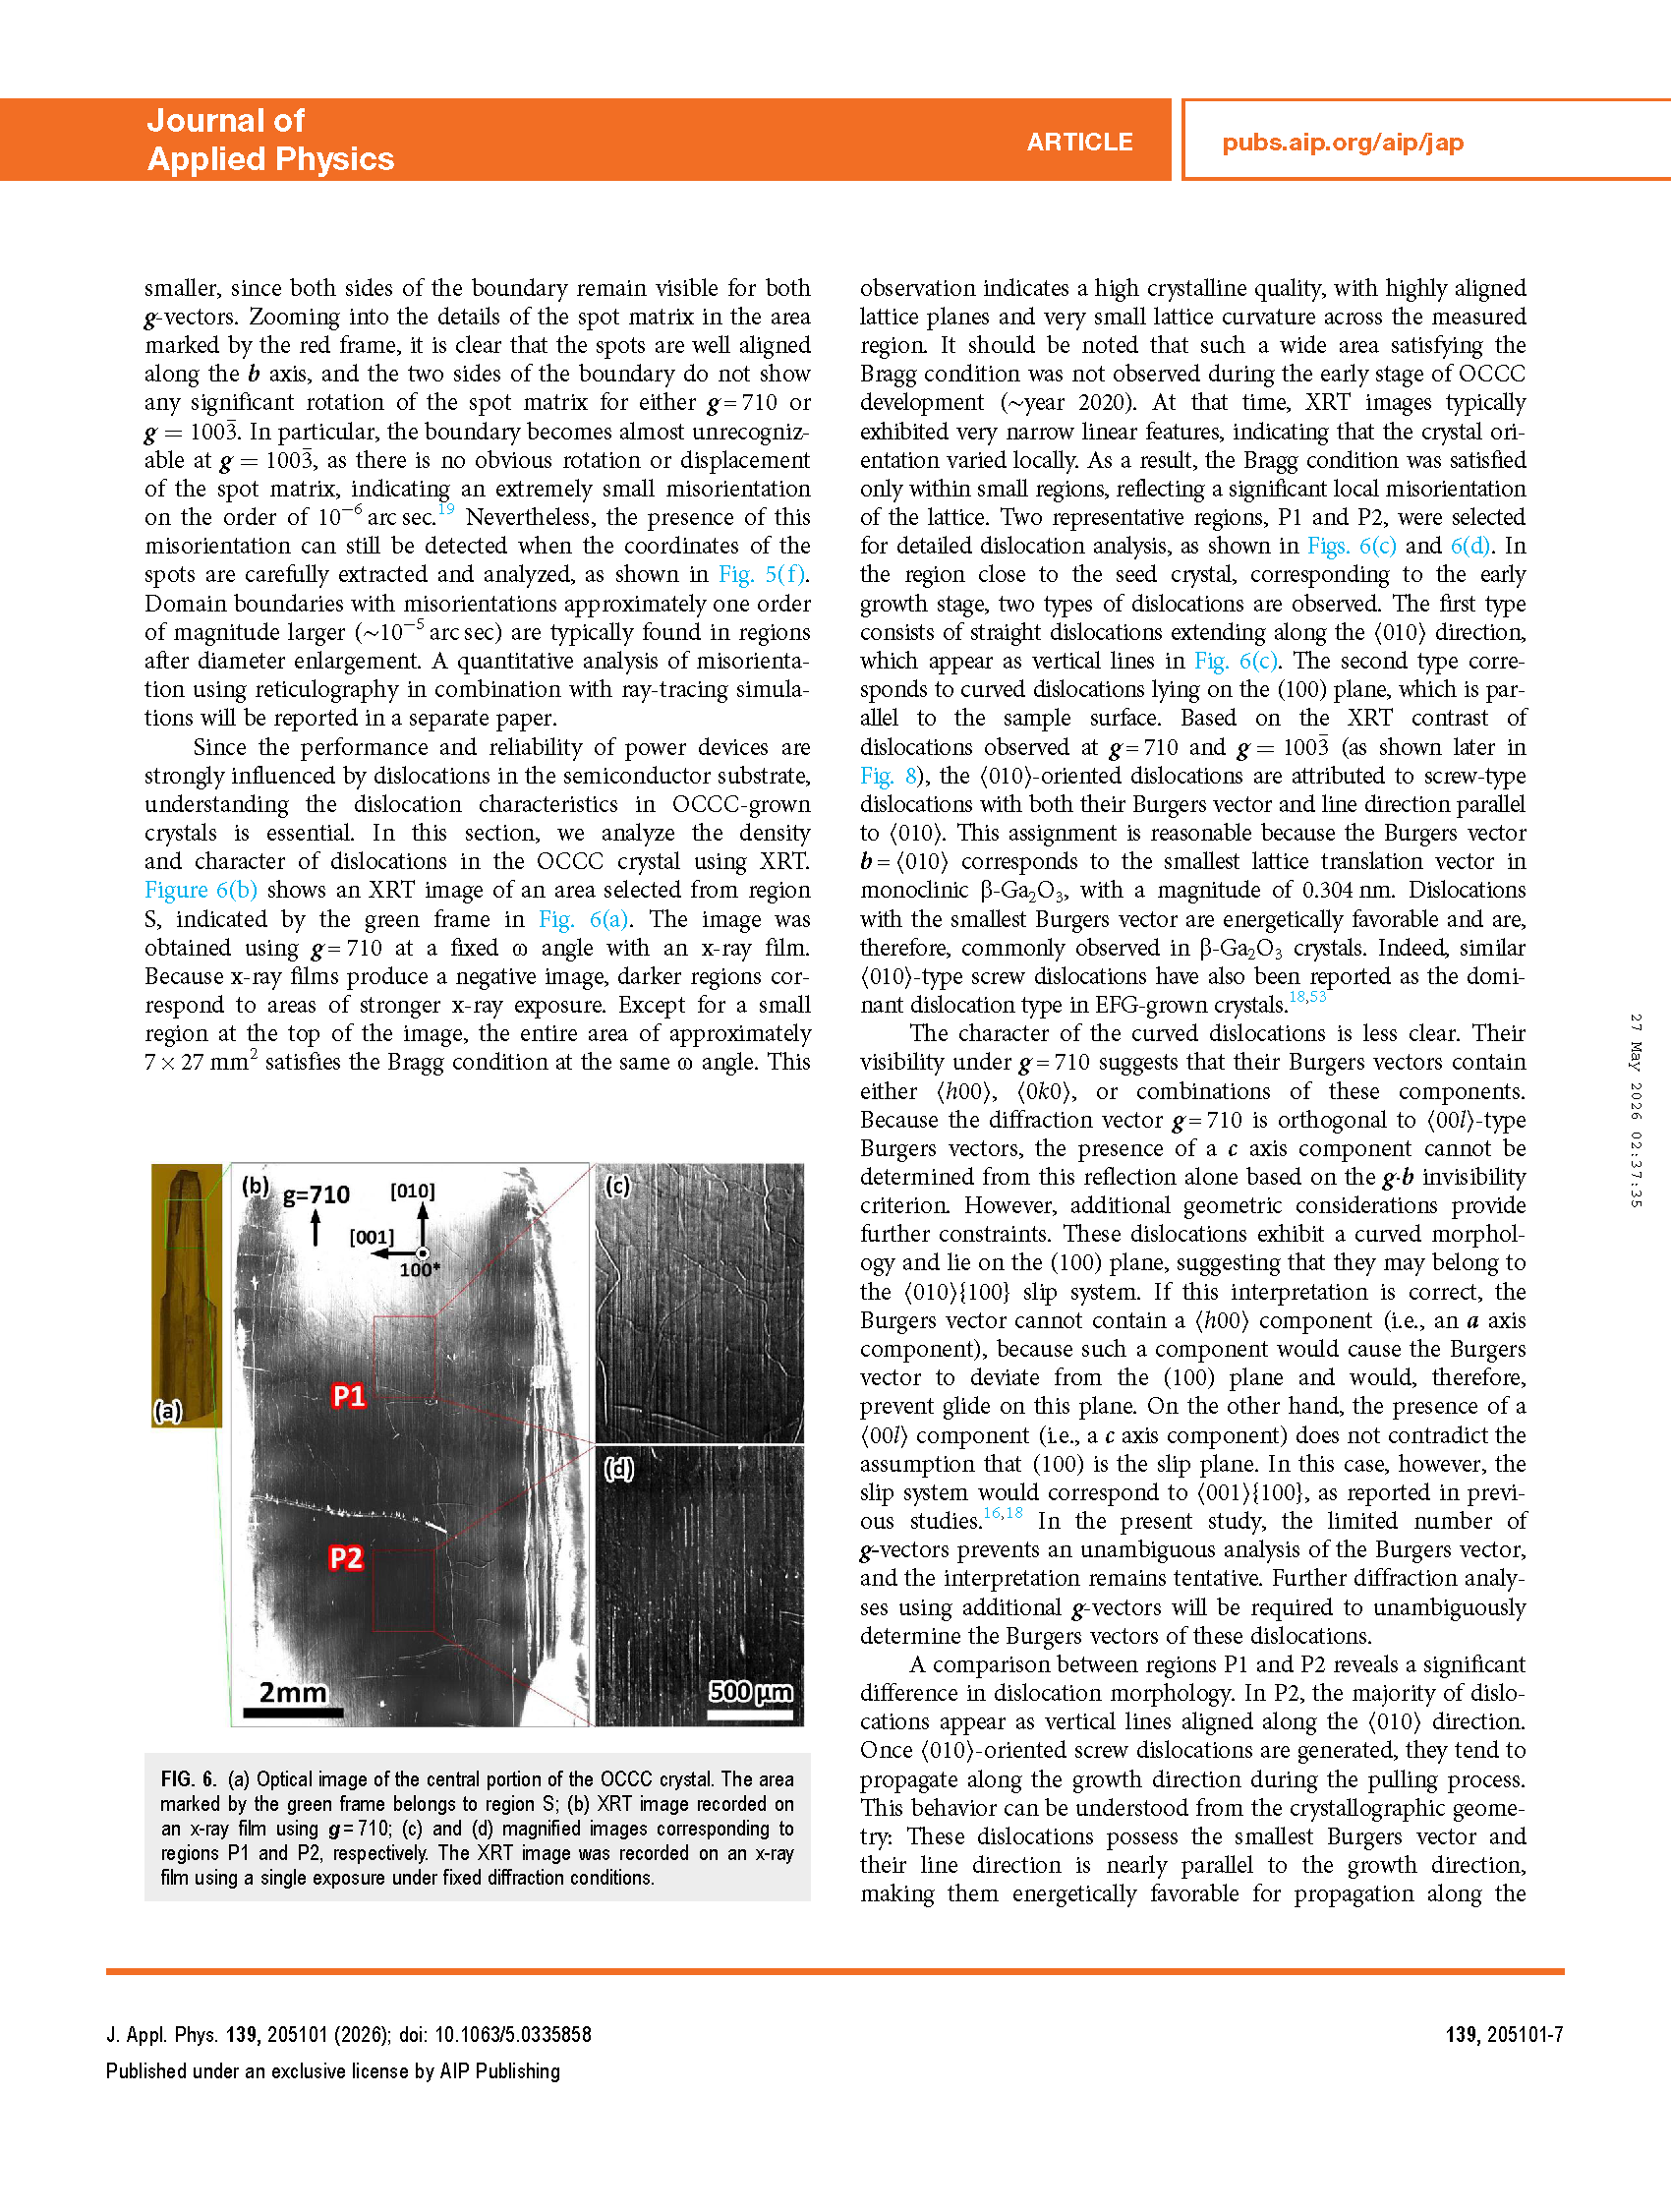
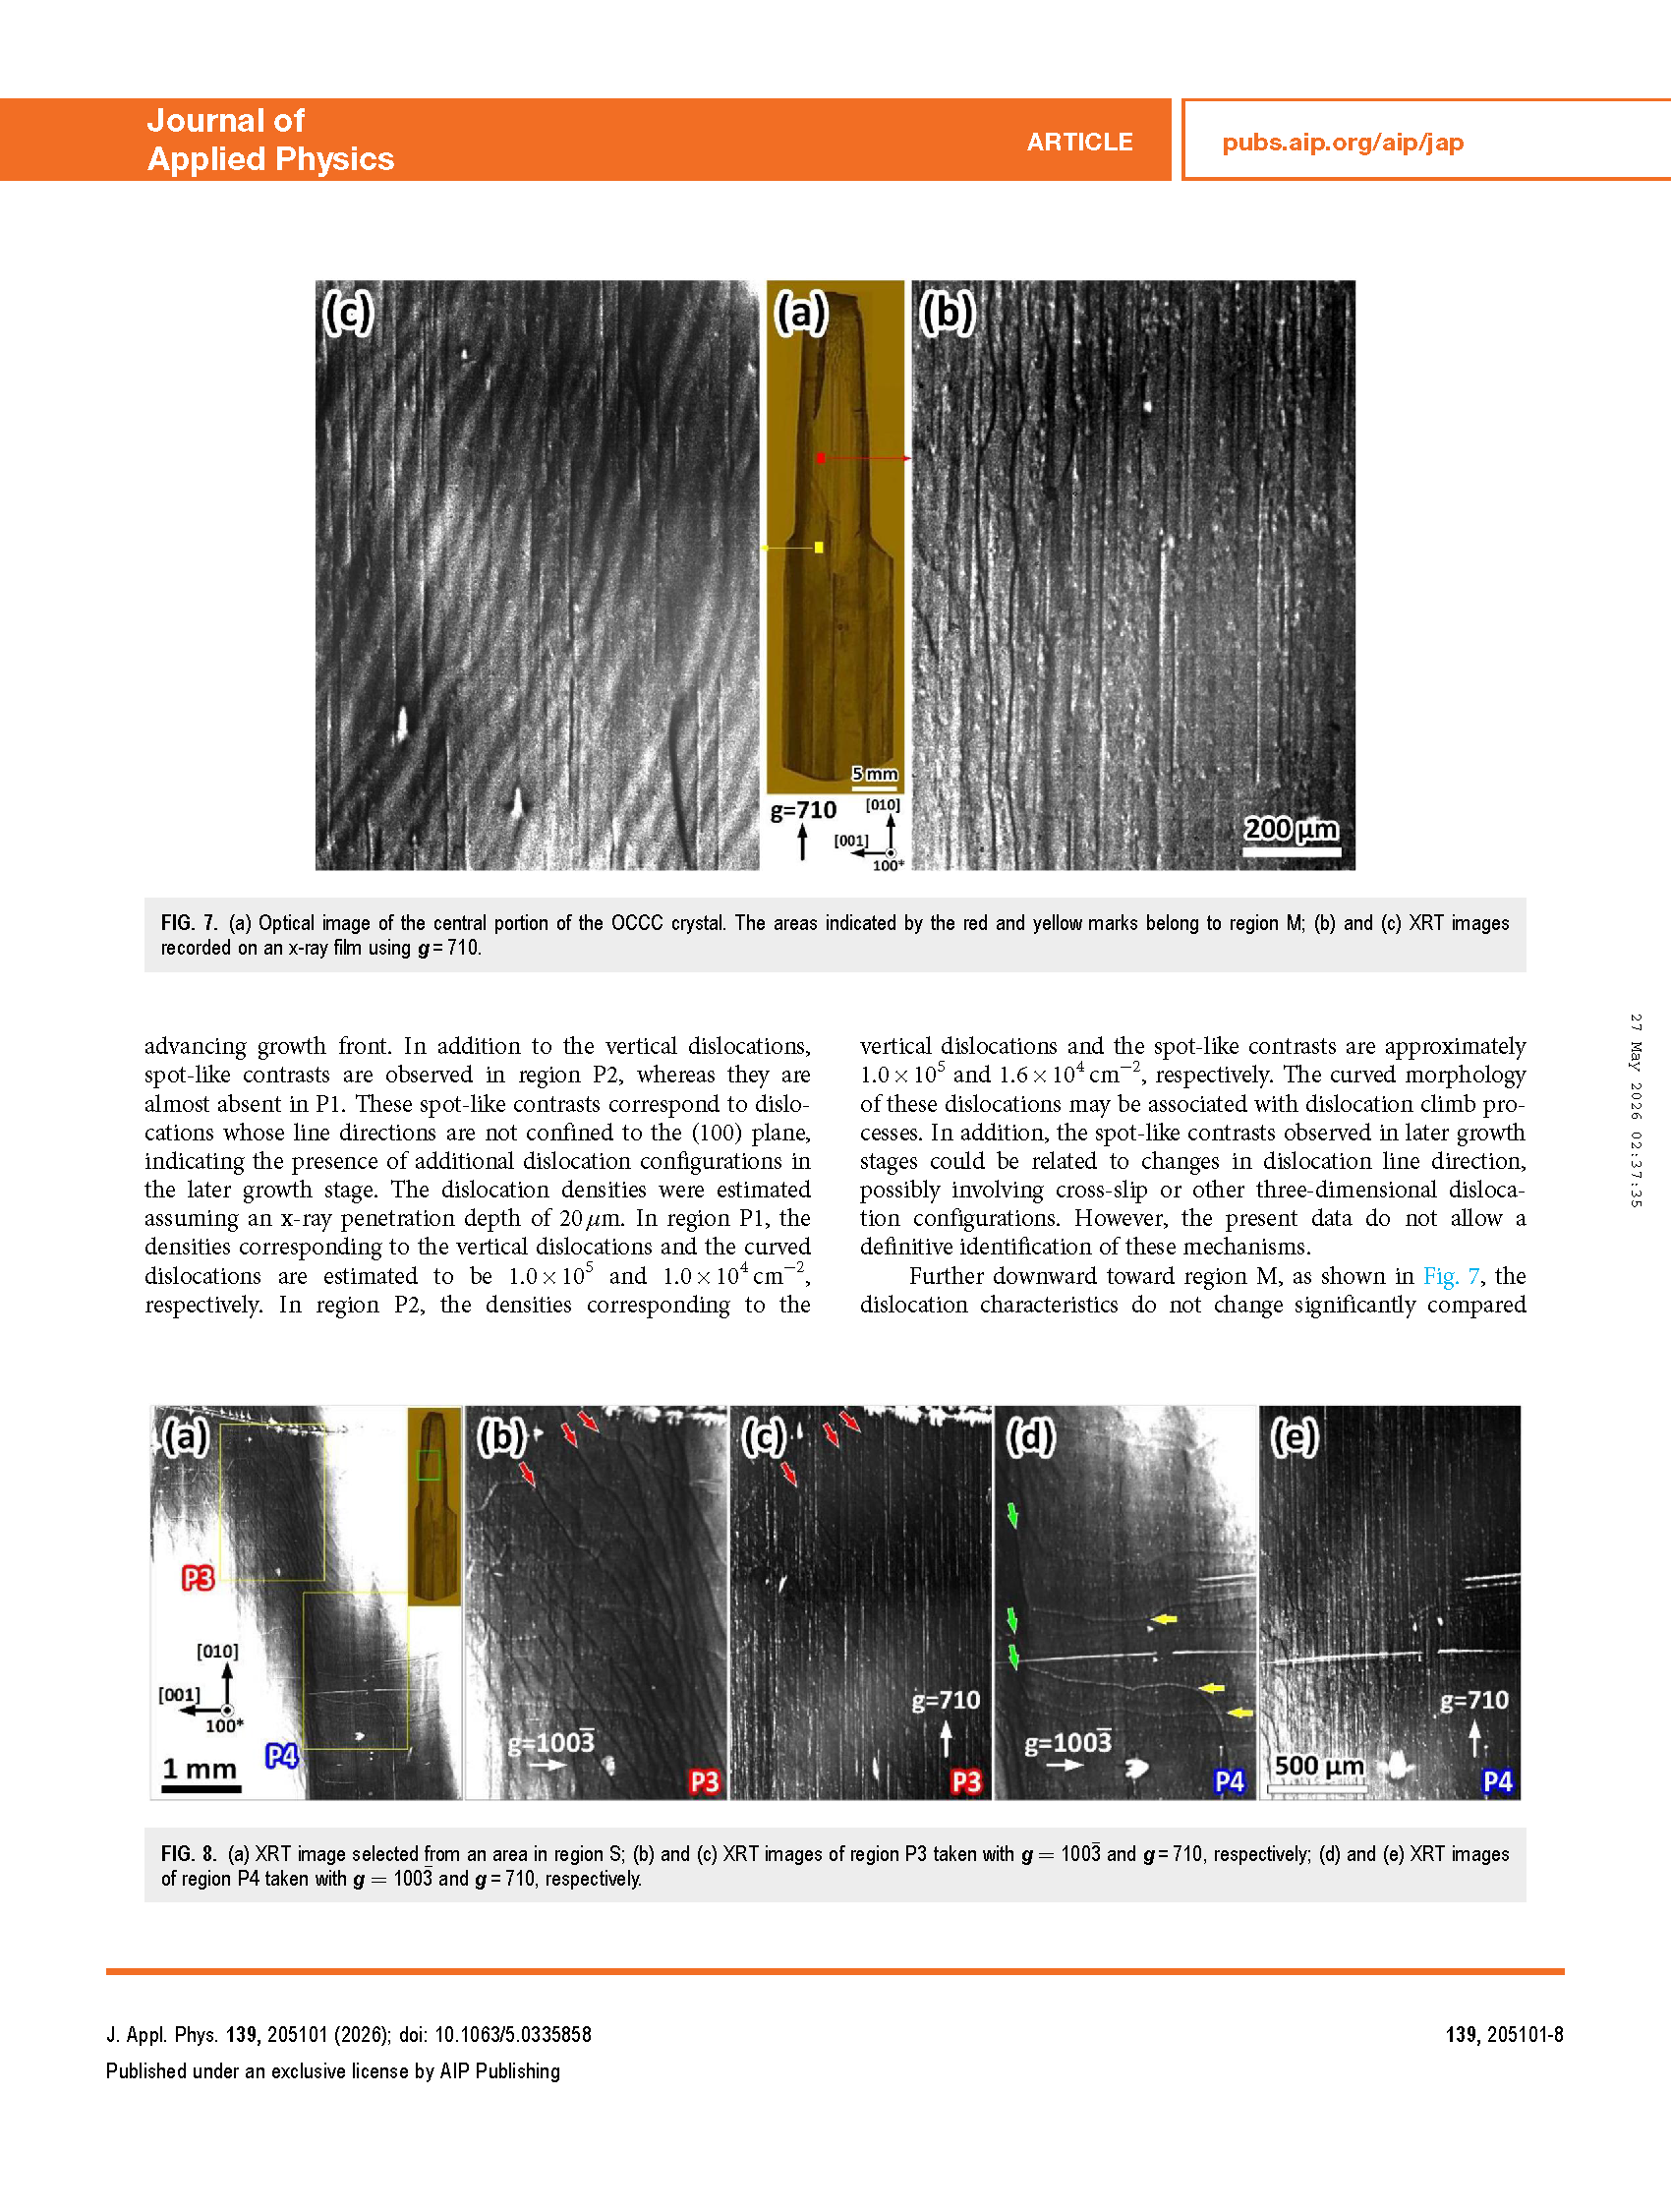
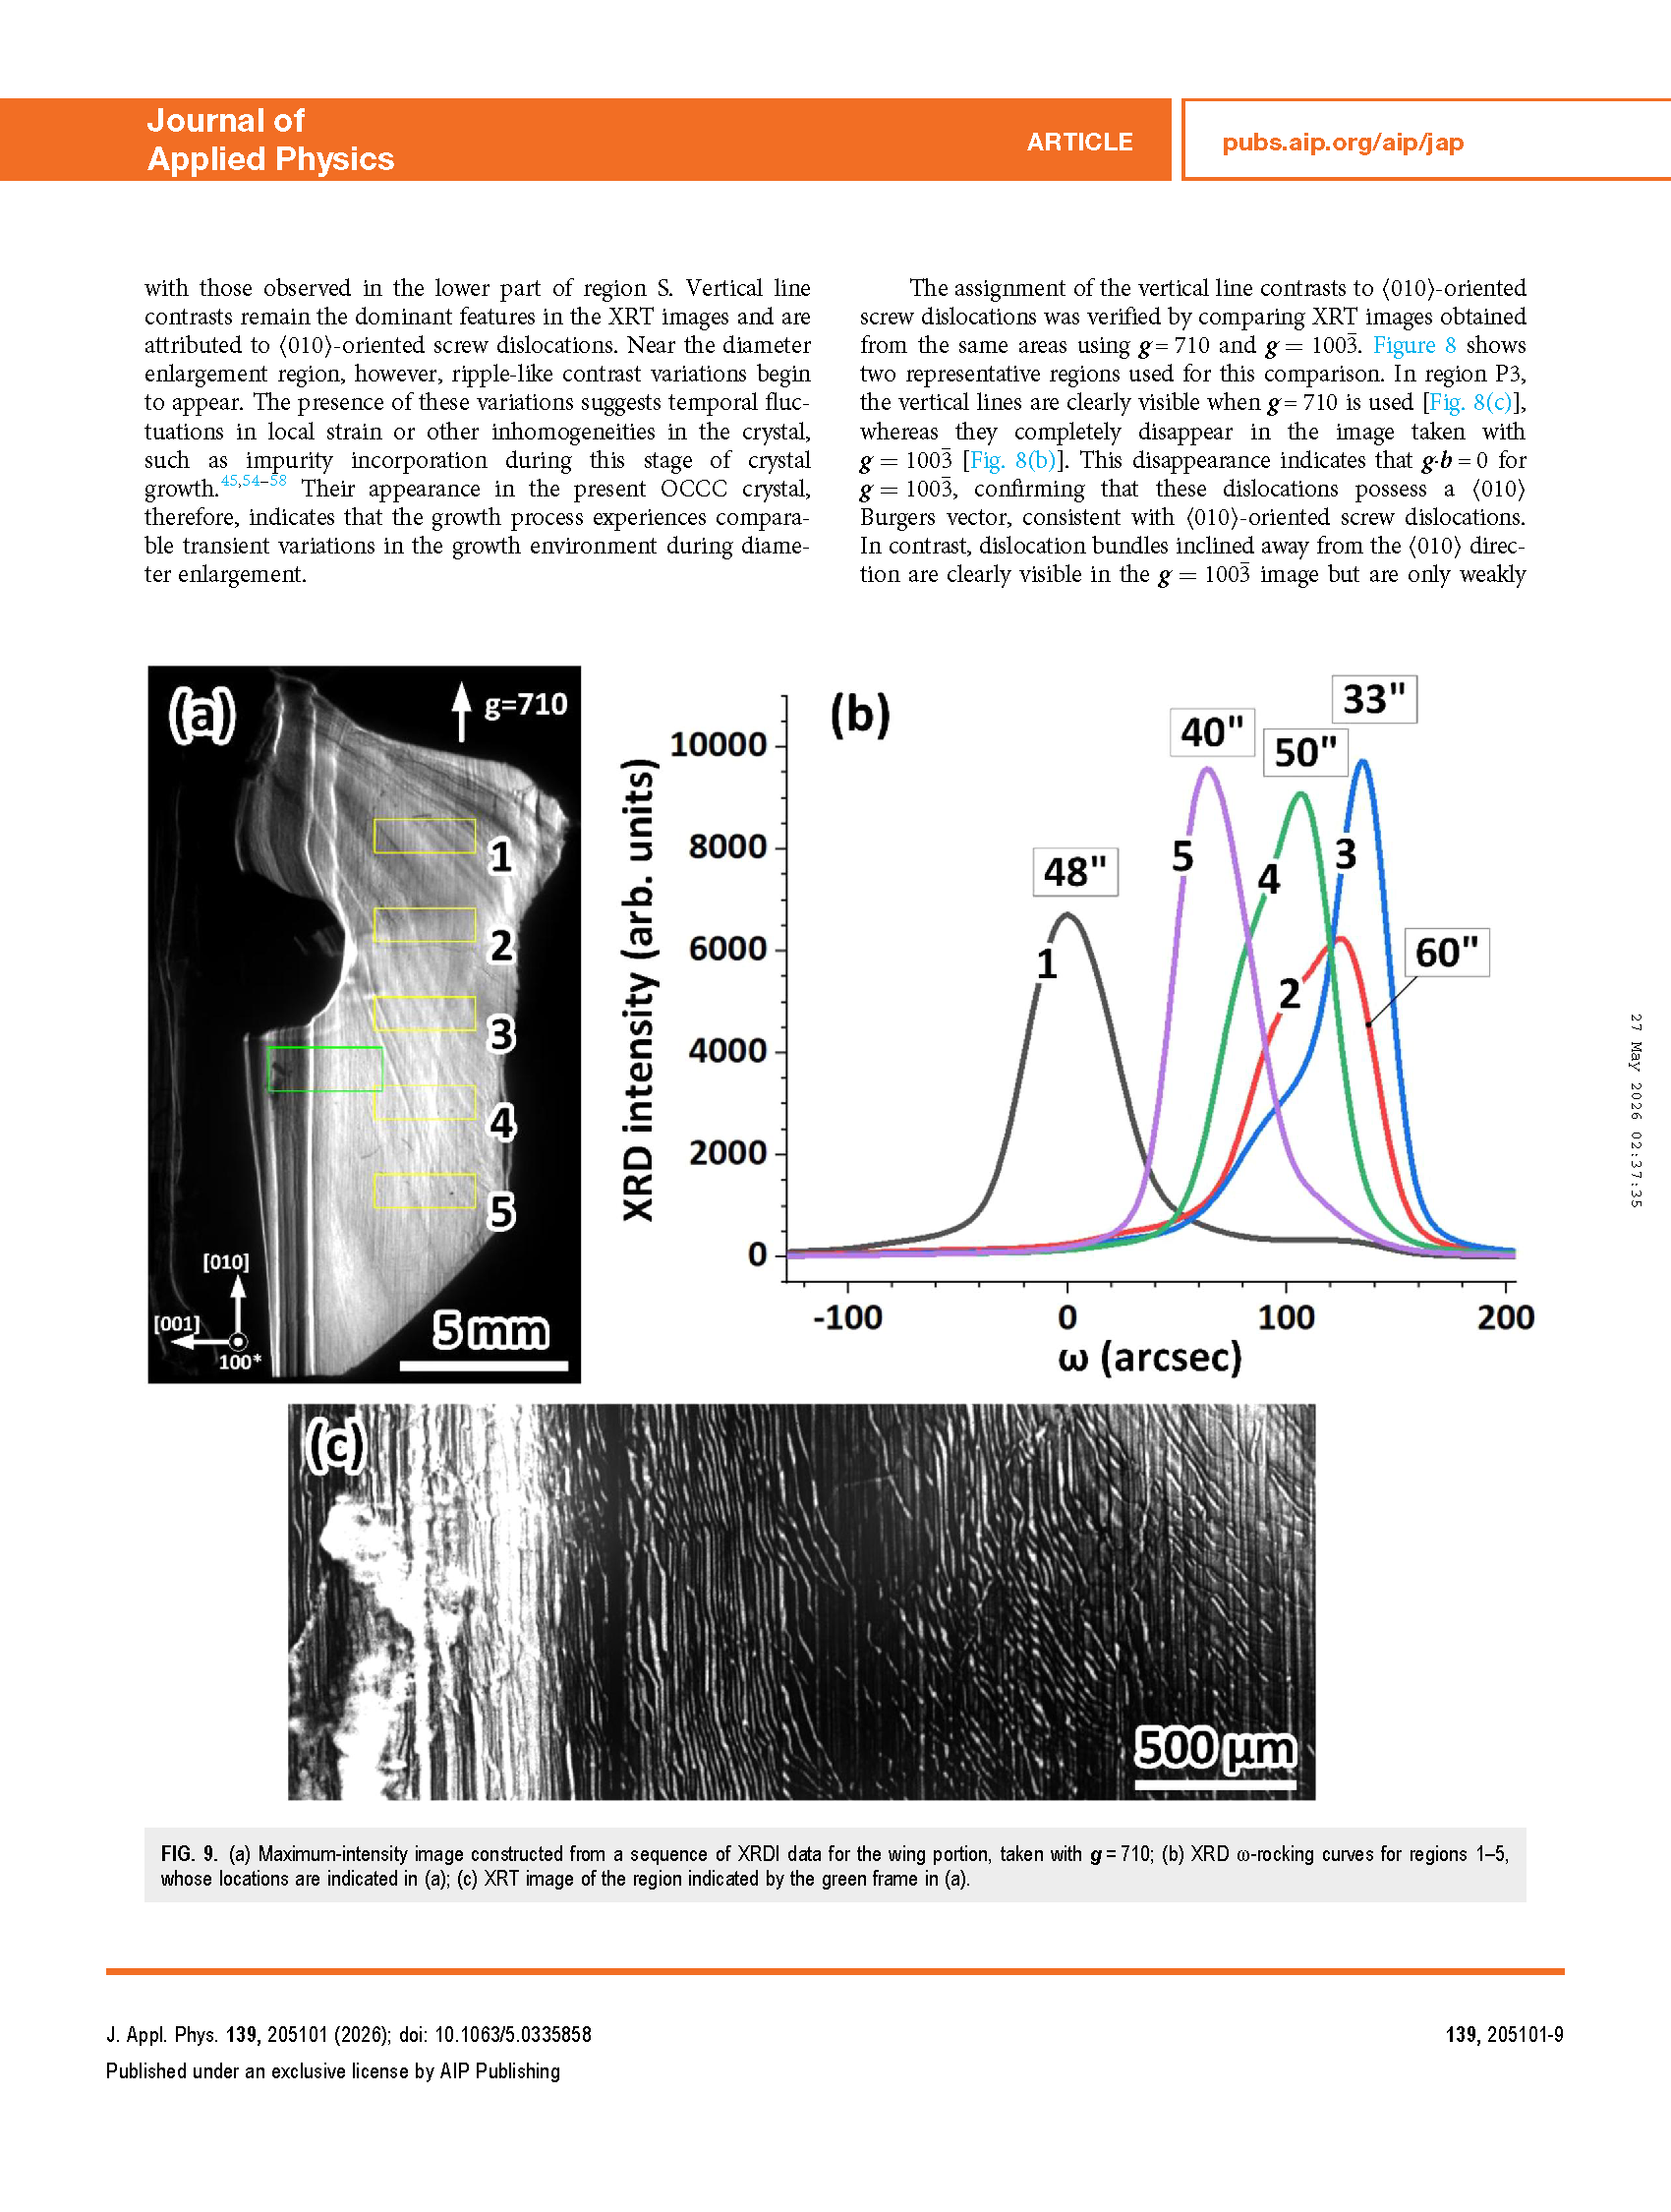
Detailed dislocation analysis revealed that the dominant defect type in the central region is the 〈010〉‑oriented screw dislocation. The assignment of these dislocations was confirmed using the g·b invisibility criterion by comparing XRT images obtained with different diffraction vectors. The density of these screw dislocations was estimated to be approximately 10⁵ cm⁻². Curved dislocations lying on the (100) plane were also observed near the seed region and are likely associated with slip systems involving 〈010〉{100} or 〈001〉{100}. As growth proceeds toward the diameter enlargement region, ripple‑like contrast variations appear, indicating temporal fluctuations in growth conditions. In the wing region formed during lateral crystal expansion, the crystalline quality deteriorates relative to the central region. This region exhibits higher dislocation densities on the order of 10⁶ cm⁻² and broader rocking curve widths (33–60 arc sec). These results suggest that diameter enlargement is a critical stage for defect generation in OCCC growth.
Overall, the present work provides a detailed characterization of lattice misorientation, domain boundaries, and dislocations in OCCC‑grown β‑Ga₂O₃ crystals. While relatively high crystalline quality was achieved in the region beneath the seed, the results also indicate that defect formation during diameter enlargement remains a critical issue. These findings highlight both the potential and the current limitations of the OCCC growth method, which is still at an early stage of development. Further optimization of growth conditions will be necessary to improve crystal quality and achieve more consistent structural properties.
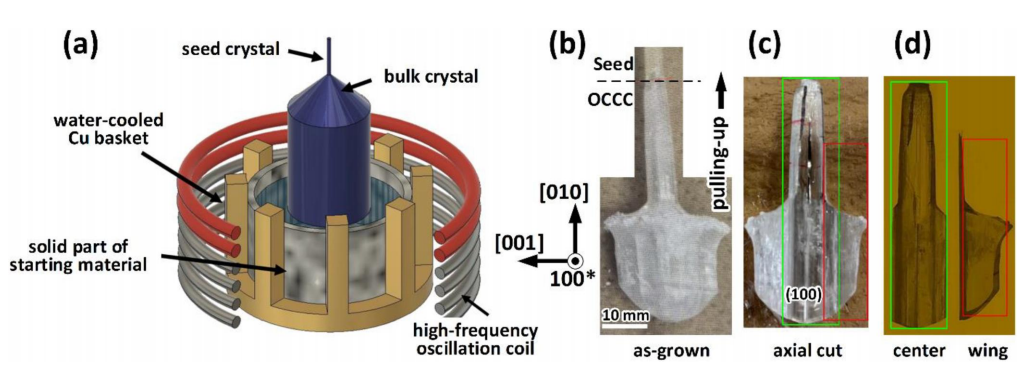
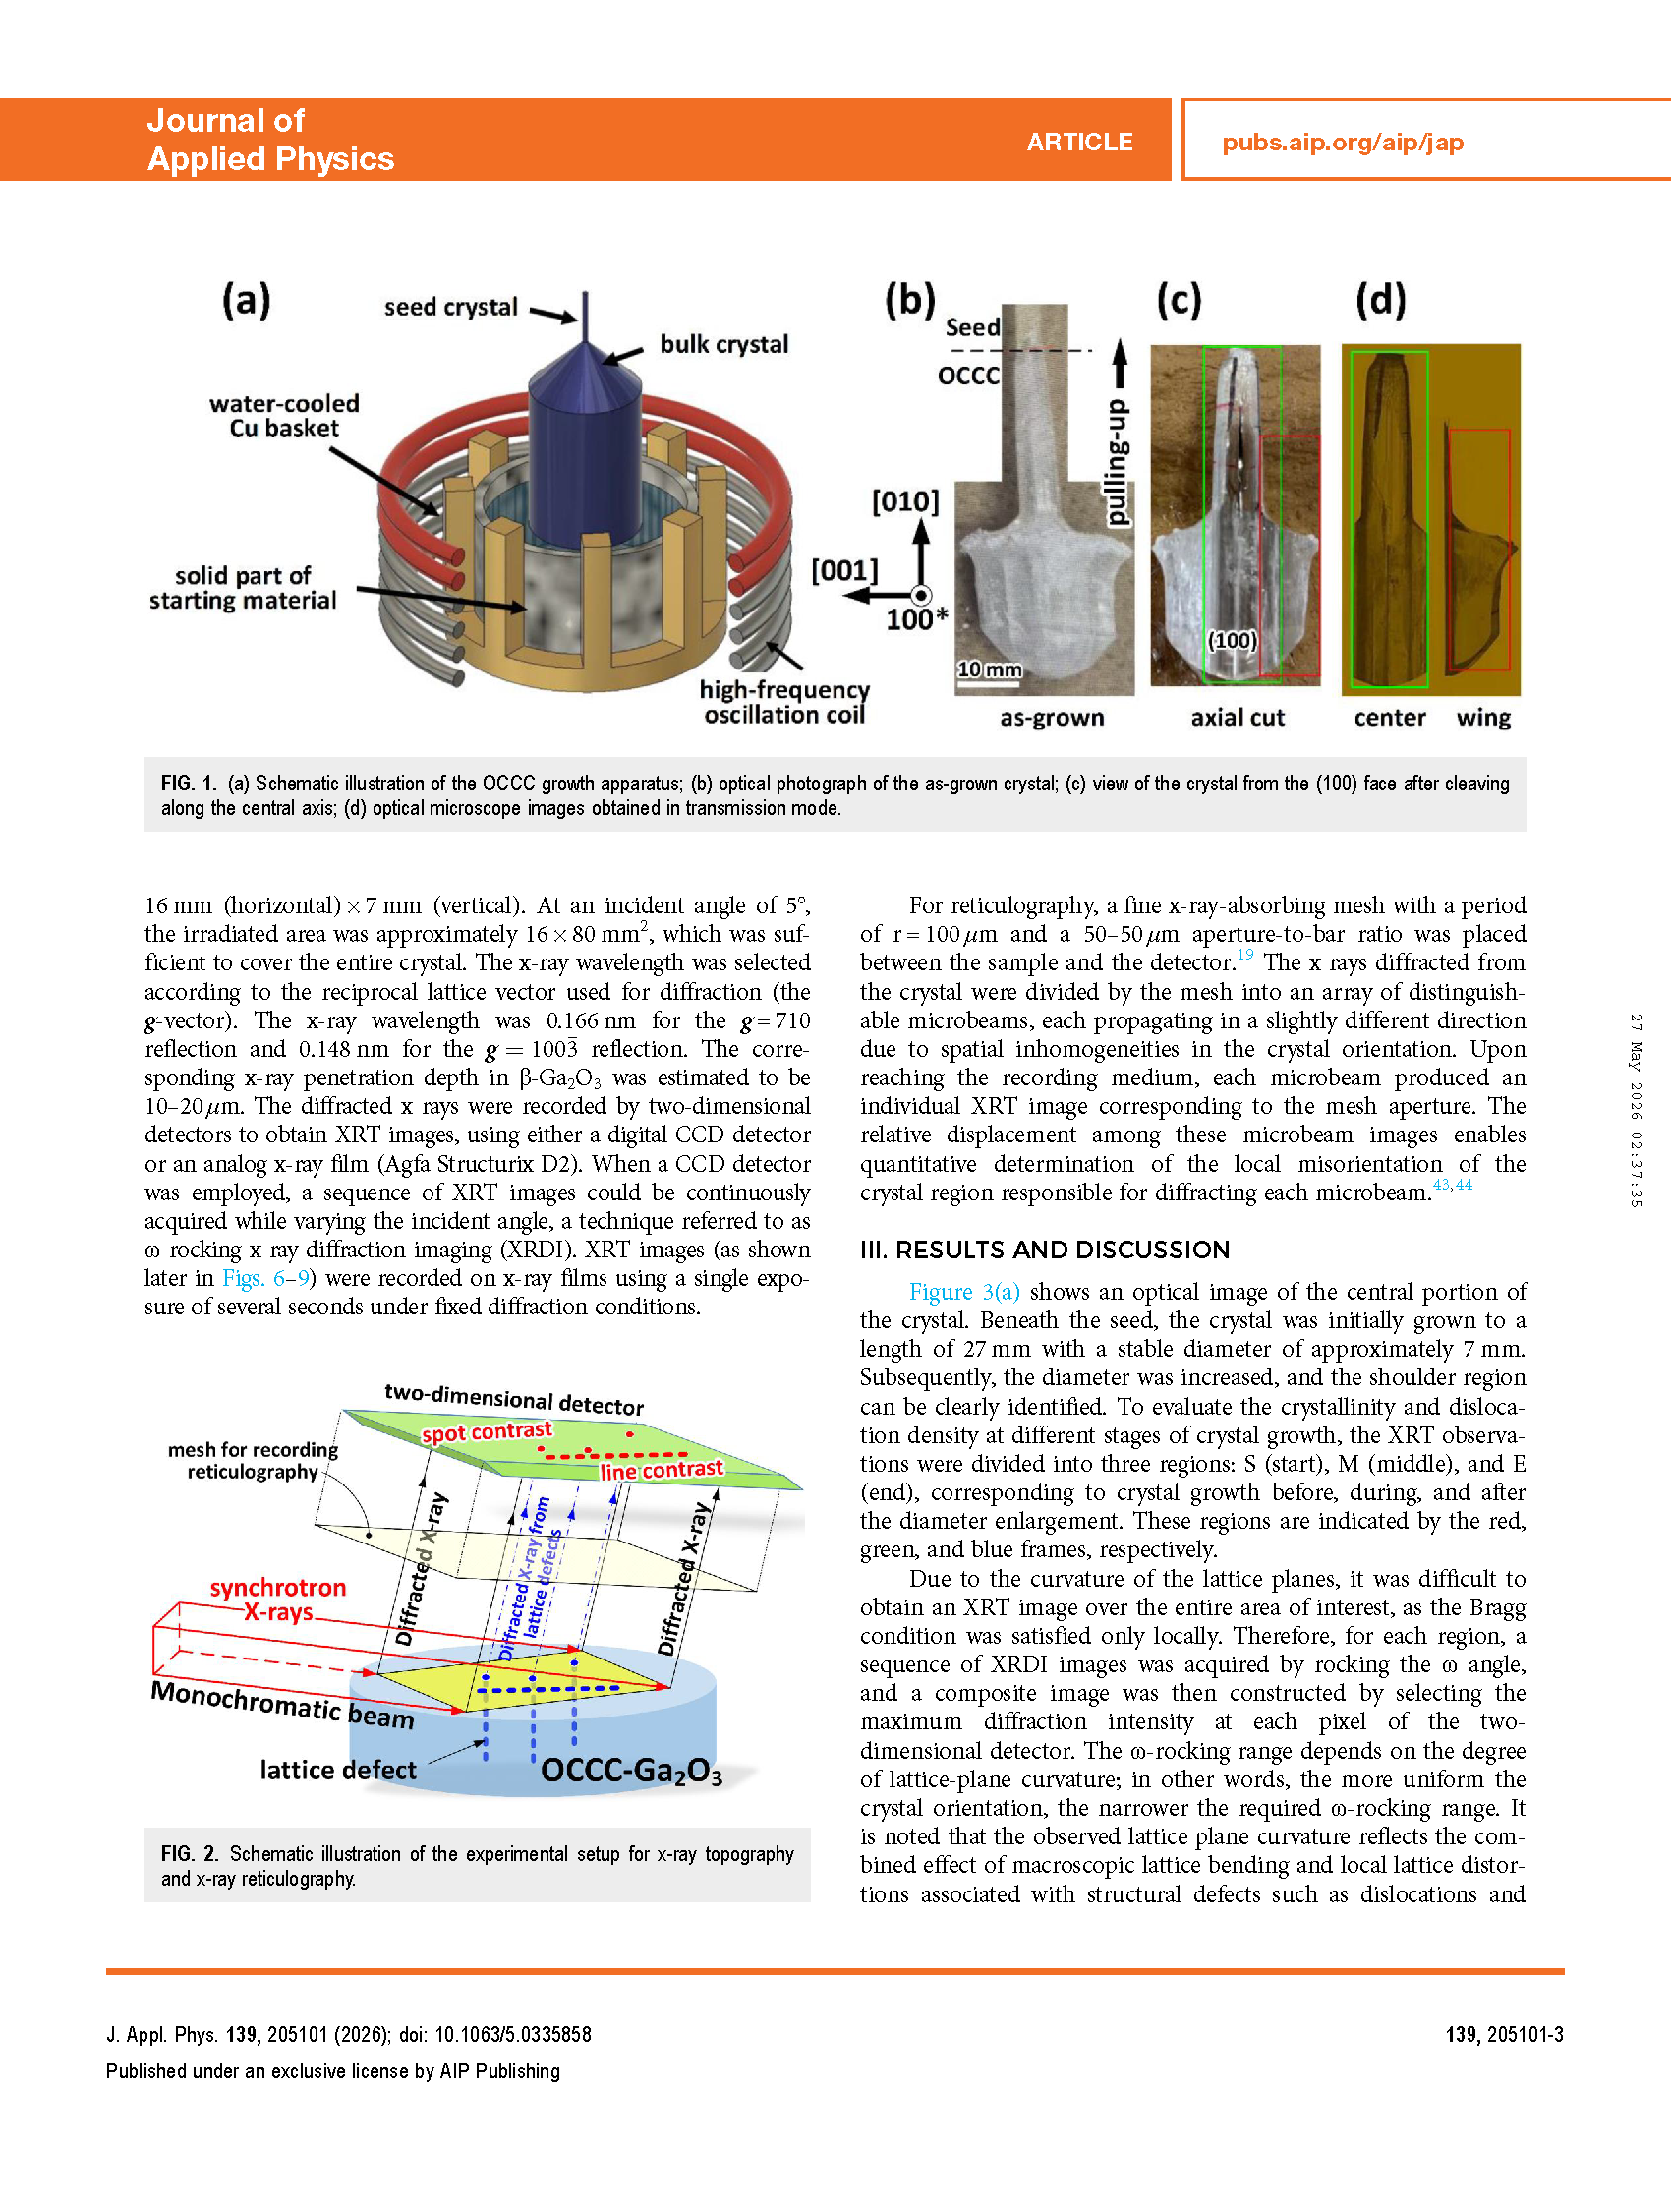
FIG. 1. (a) Schematic illustration of the OCCC growth apparatus; (b) optical photograph of the as-grown crystal; (c) view of the crystal from the (100) face after cleaving along the central axis; (d) optical microscope images obtained in transmission mode.
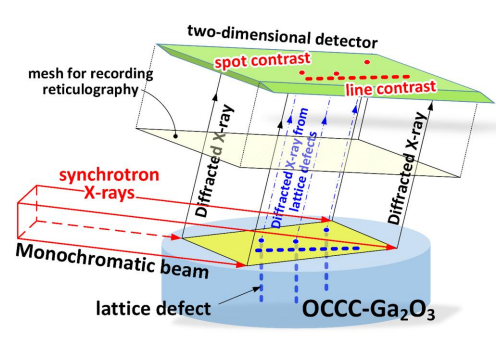
FIG. 2. Schematic illustration of the experimental setup for x-ray topography and x-ray reticulography.
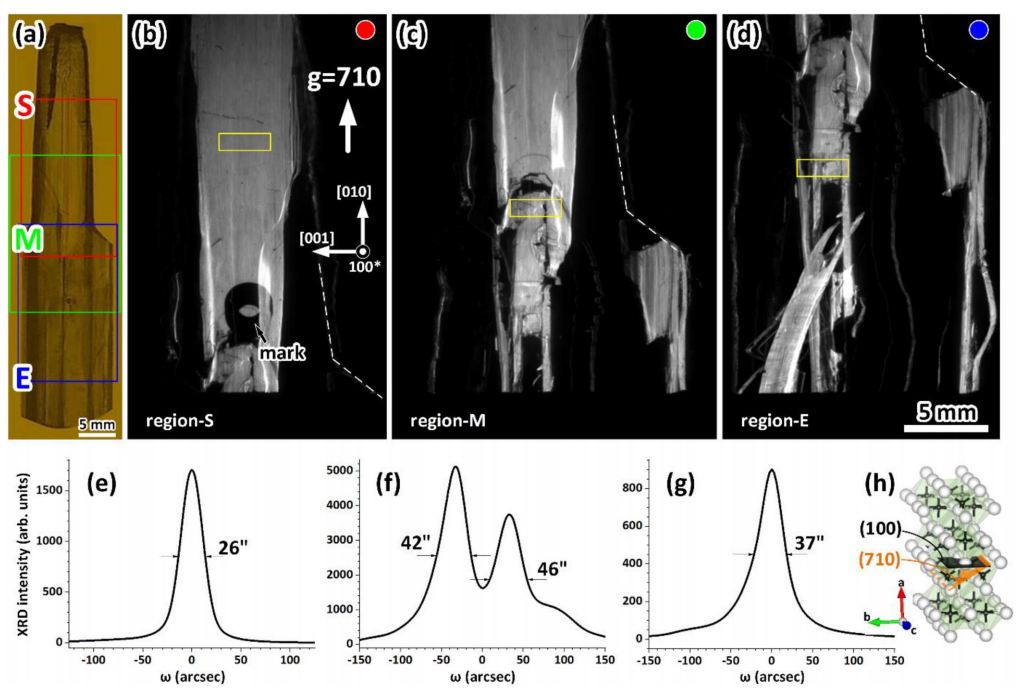
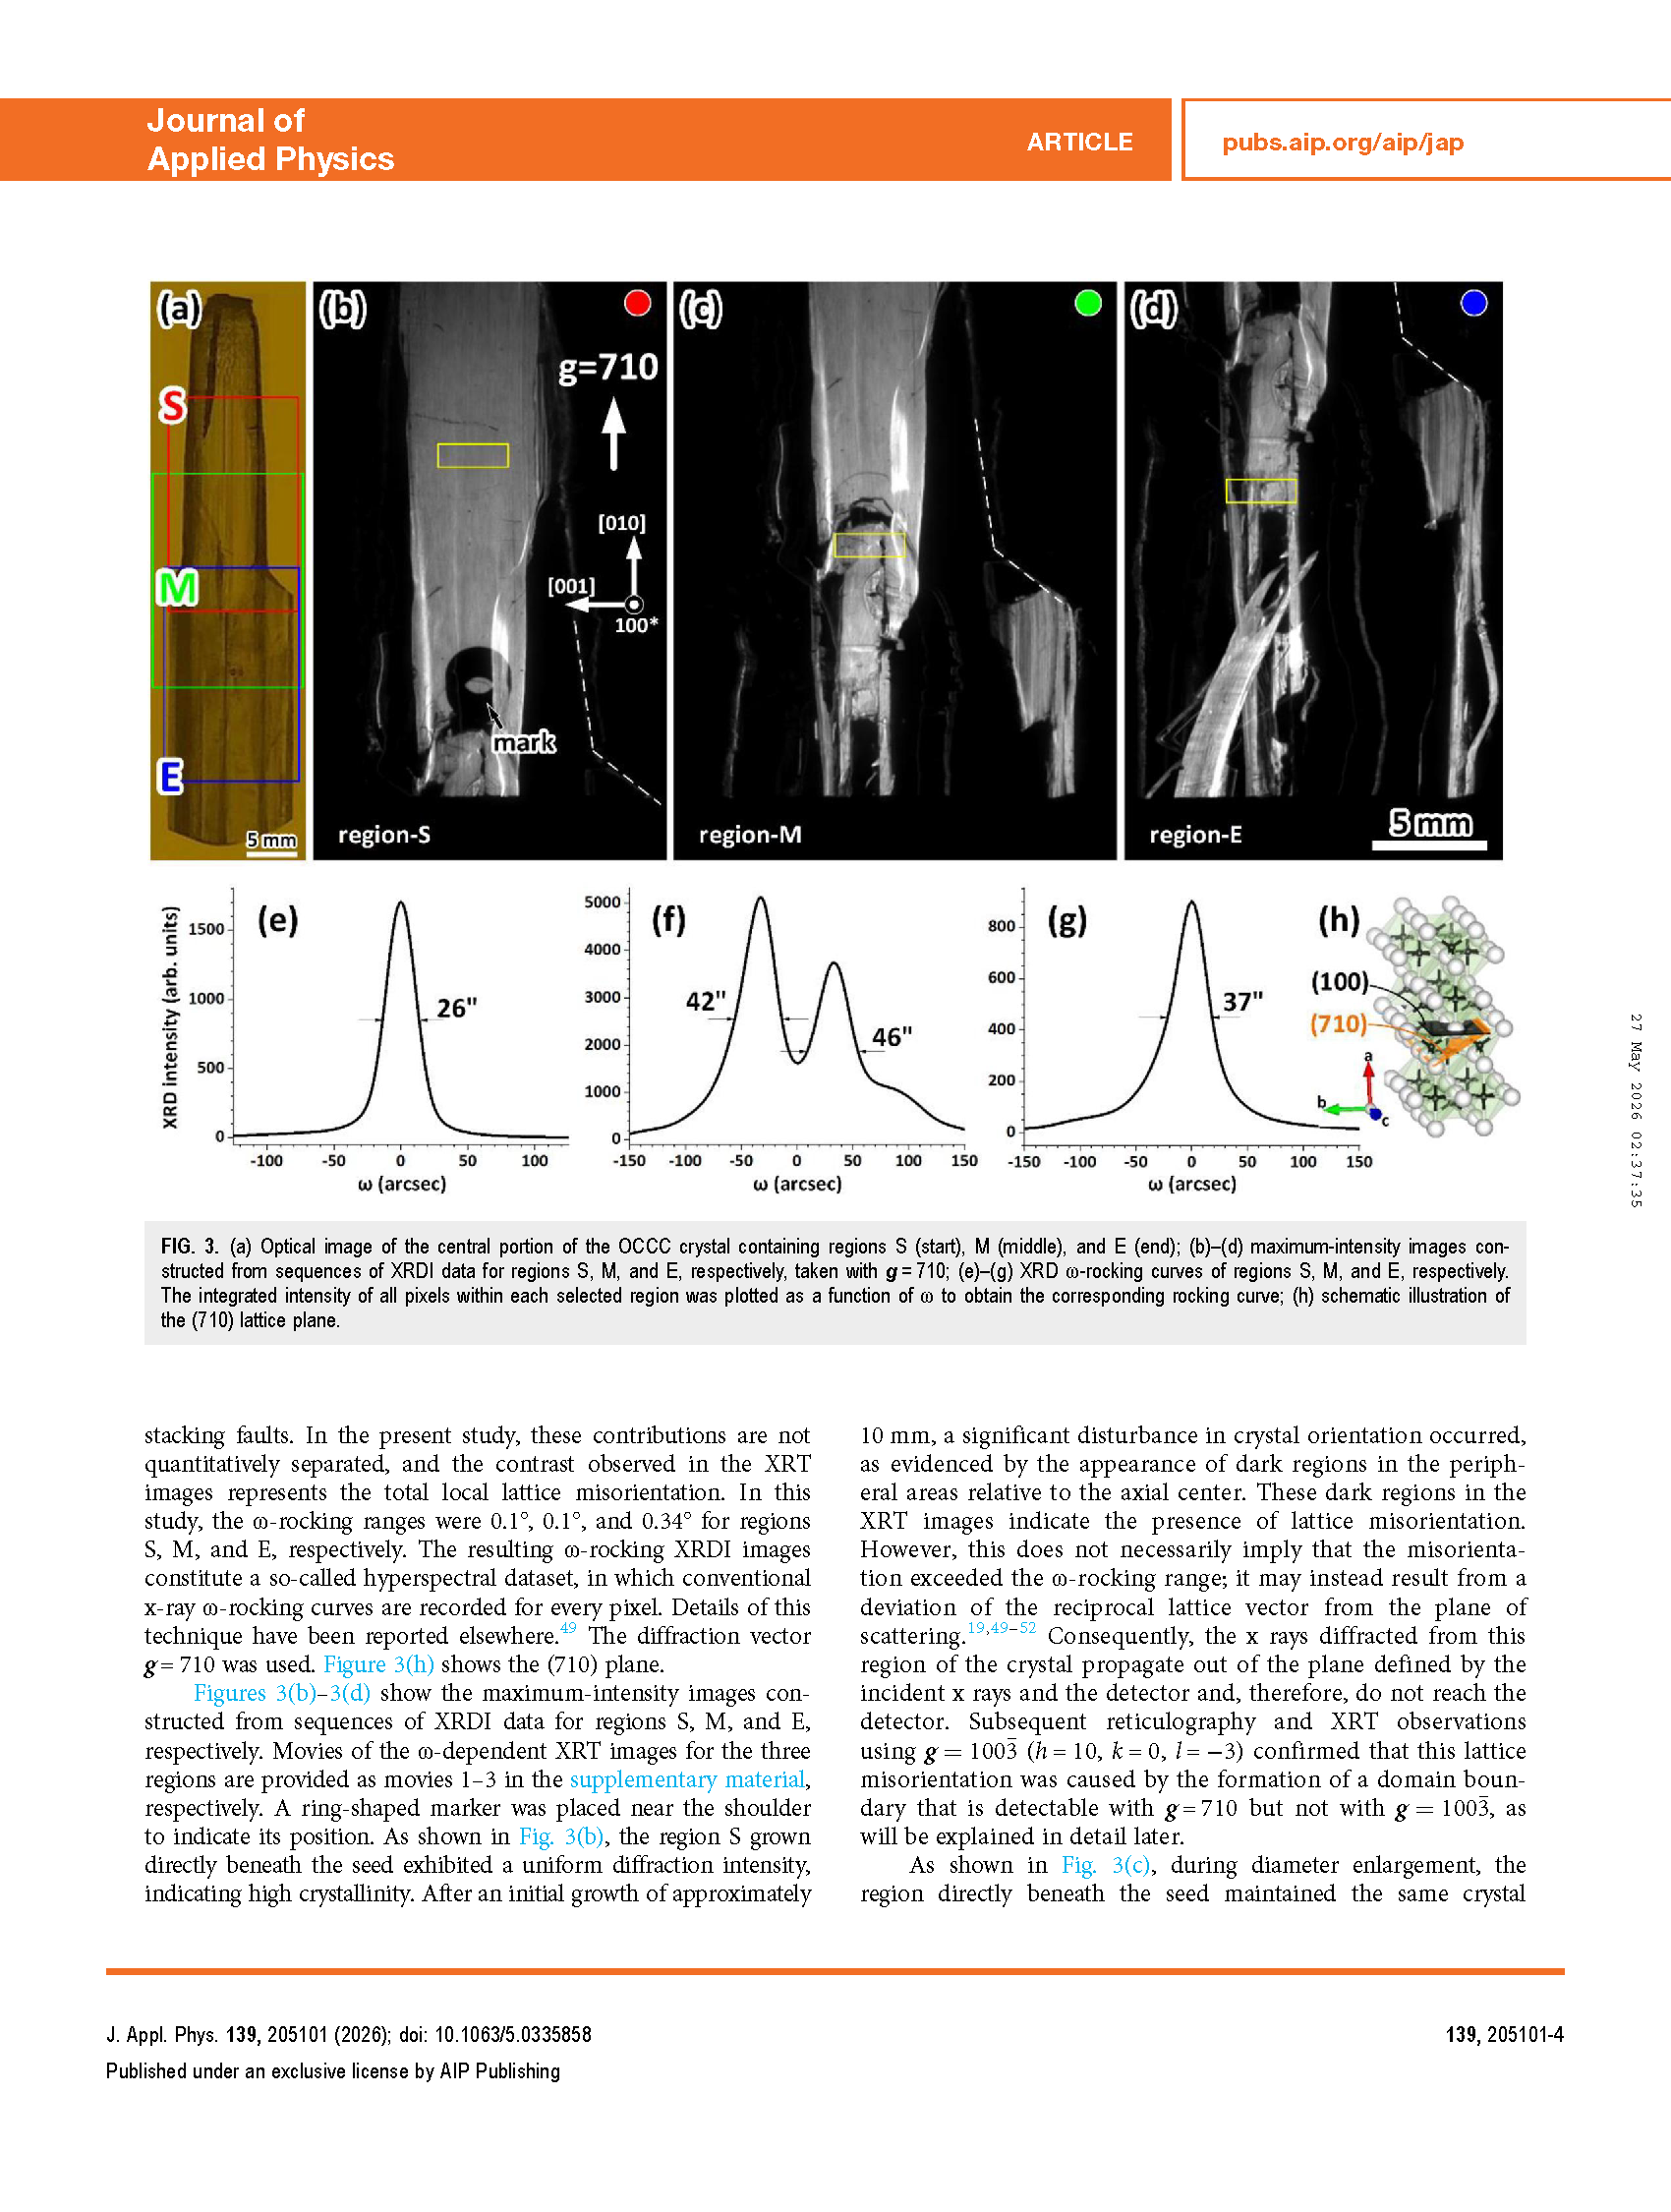
FIG. 3. (a) Optical image of the central portion of the OCCC crystal containing regions S (start), M (middle), and E (end); (b)–(d) maximum-intensity images constructed from sequences of XRDI data for regions S, M, and E, respectively, taken with g=710; (e)–(g) XRD ω-rocking curves of regions S, M, and E, respectively. The integrated intensity of all pixels within each selected region was plotted as a function of ω to obtain the corresponding rocking curve; (h) schematic illustration of the (710) lattice plane.
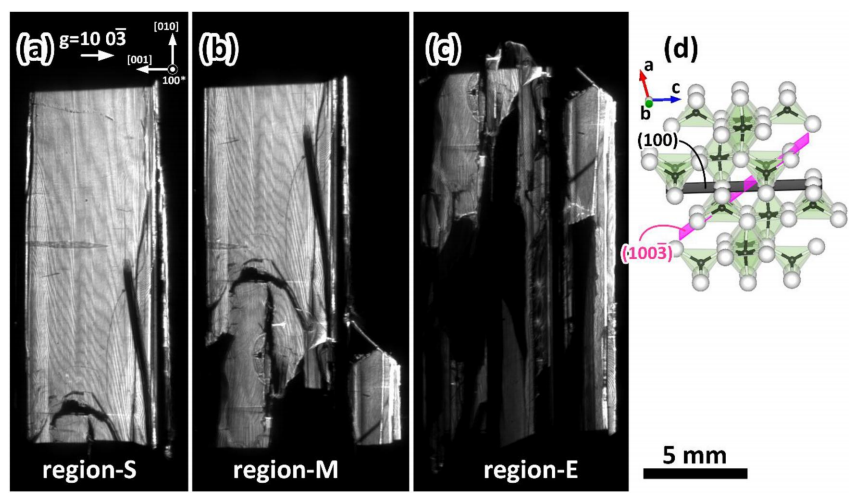
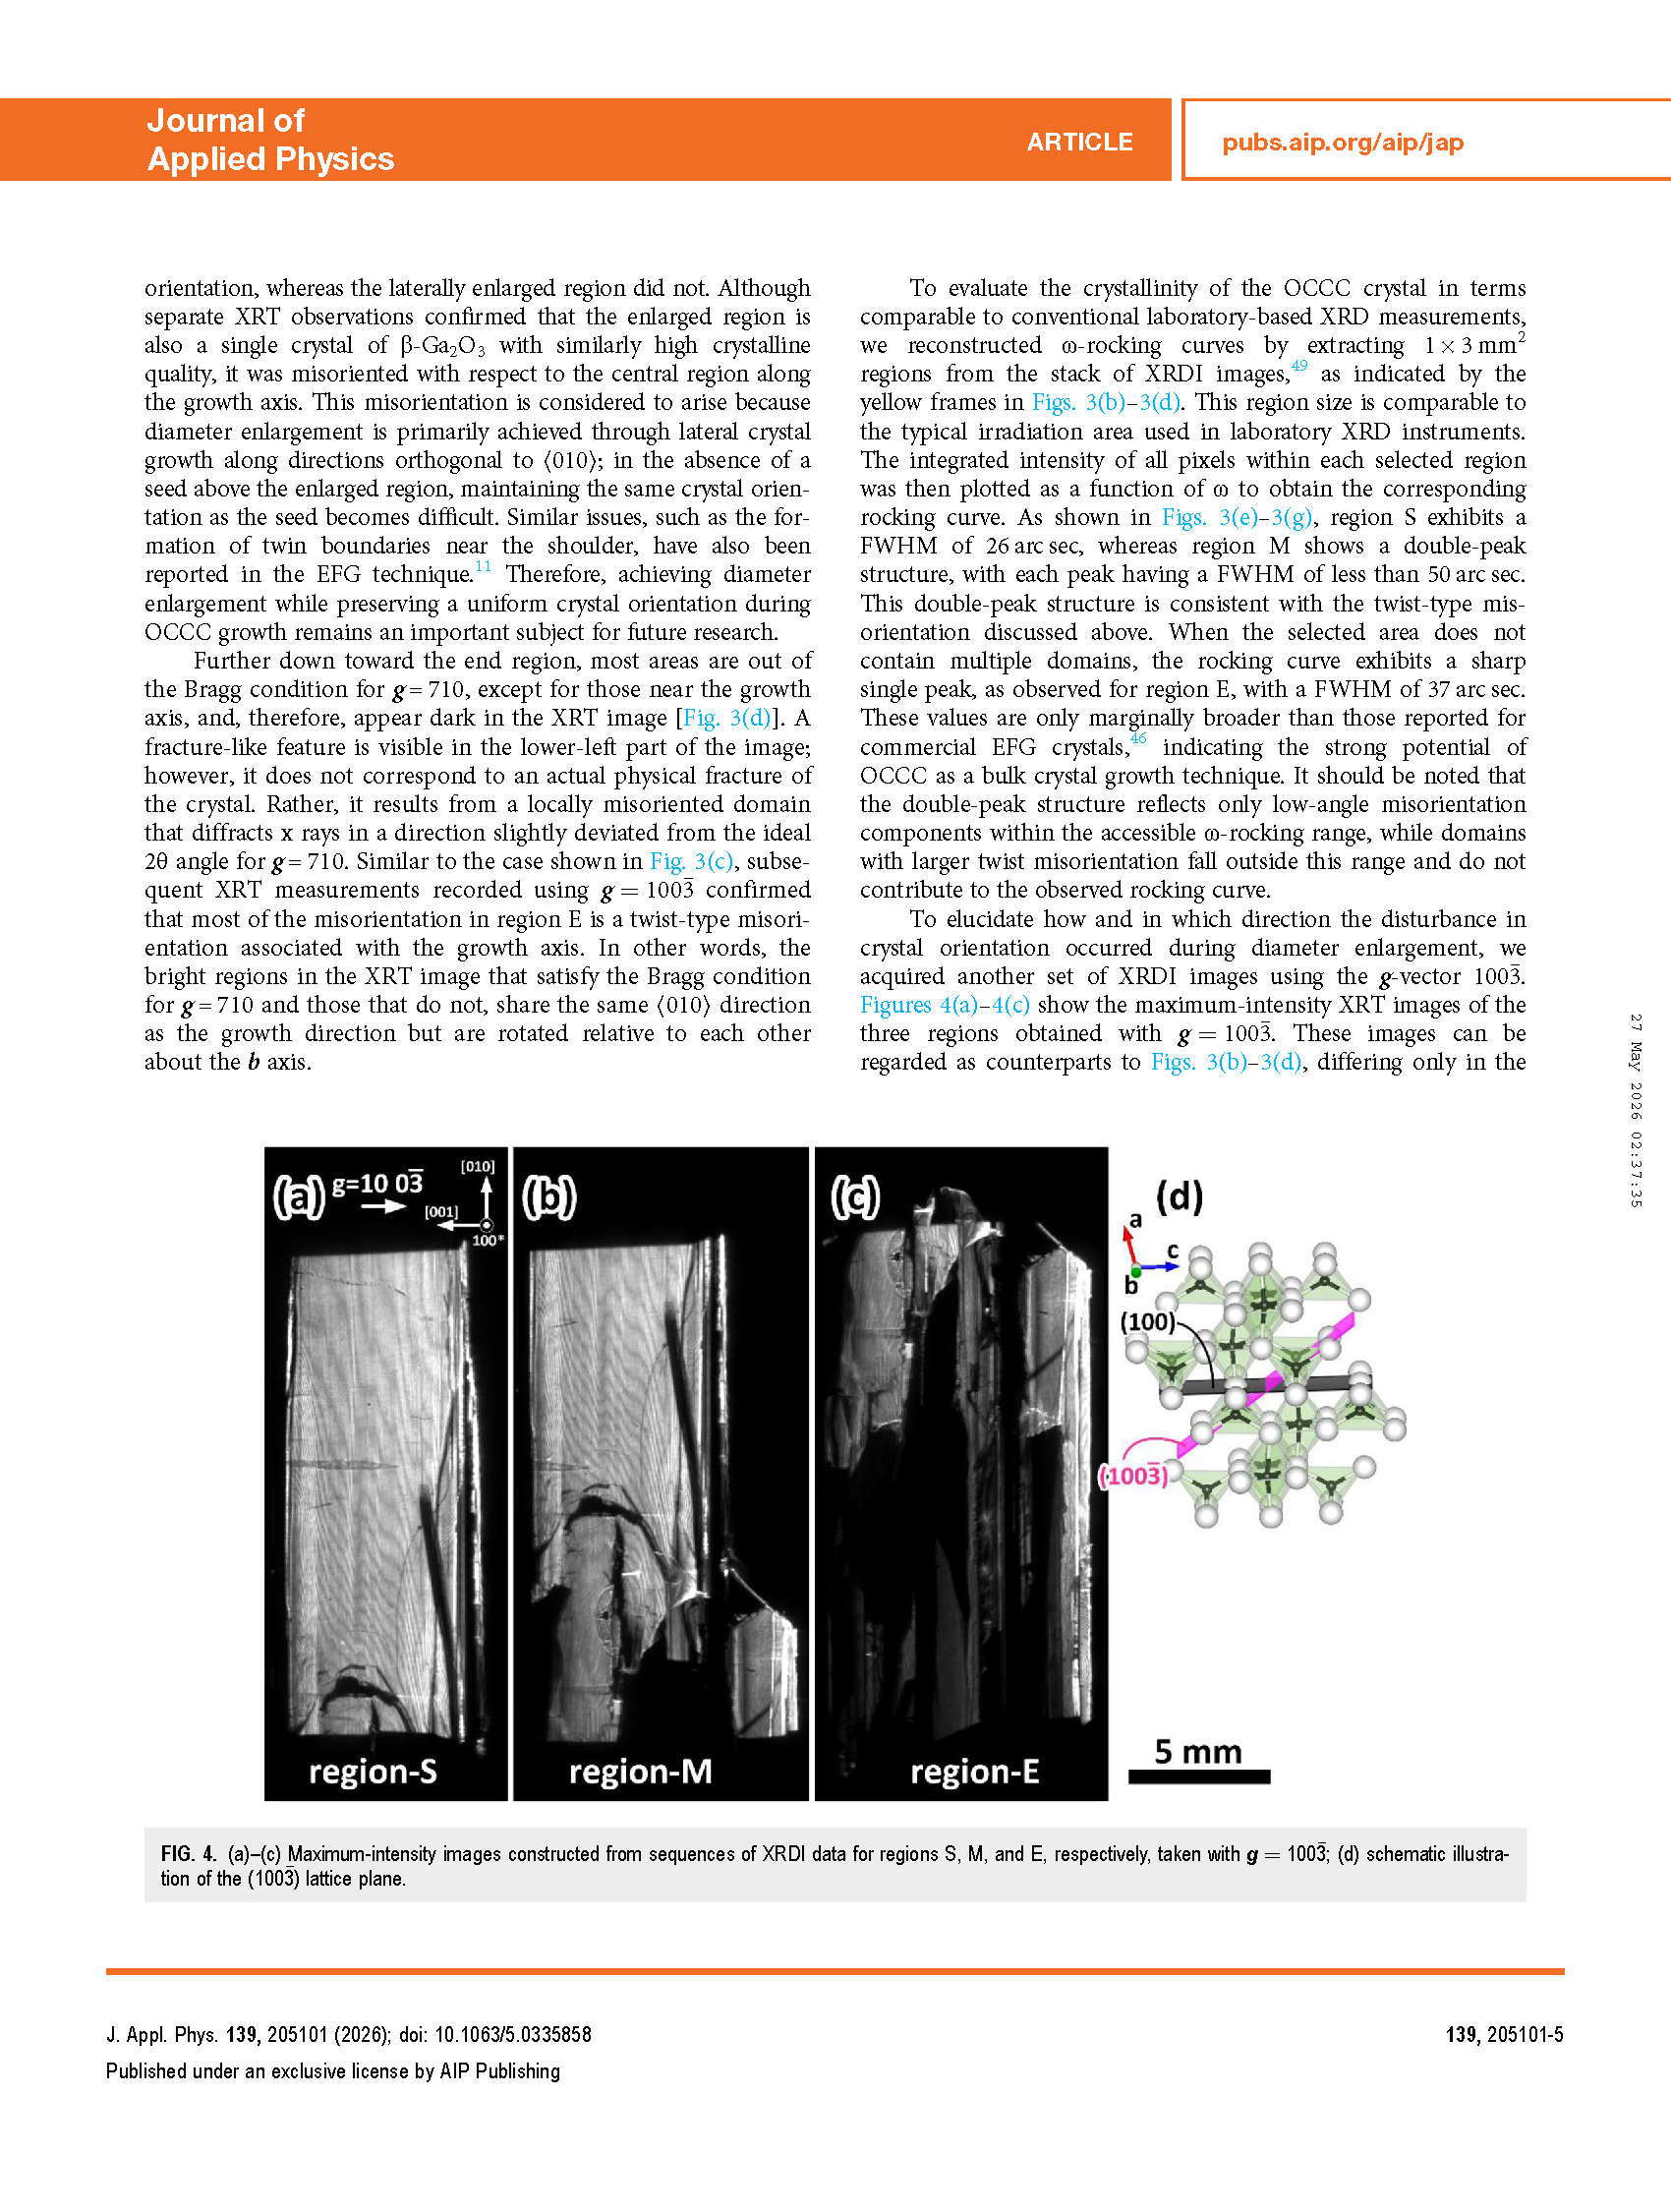
FIG. 4. (a)–(c) Maximum-intensity images constructed from sequences of XRDI data for regions S, M, and E, respectively, taken with g=100-3; (d) schematic illustration of the (100-3) lattice plane.
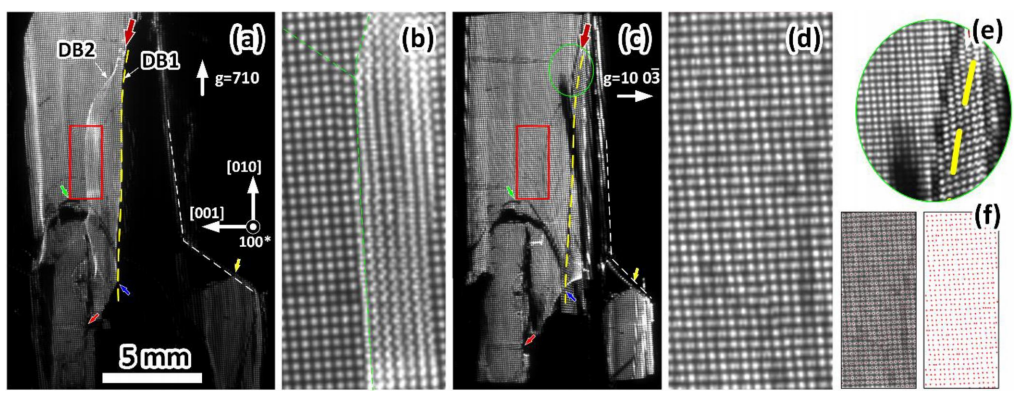
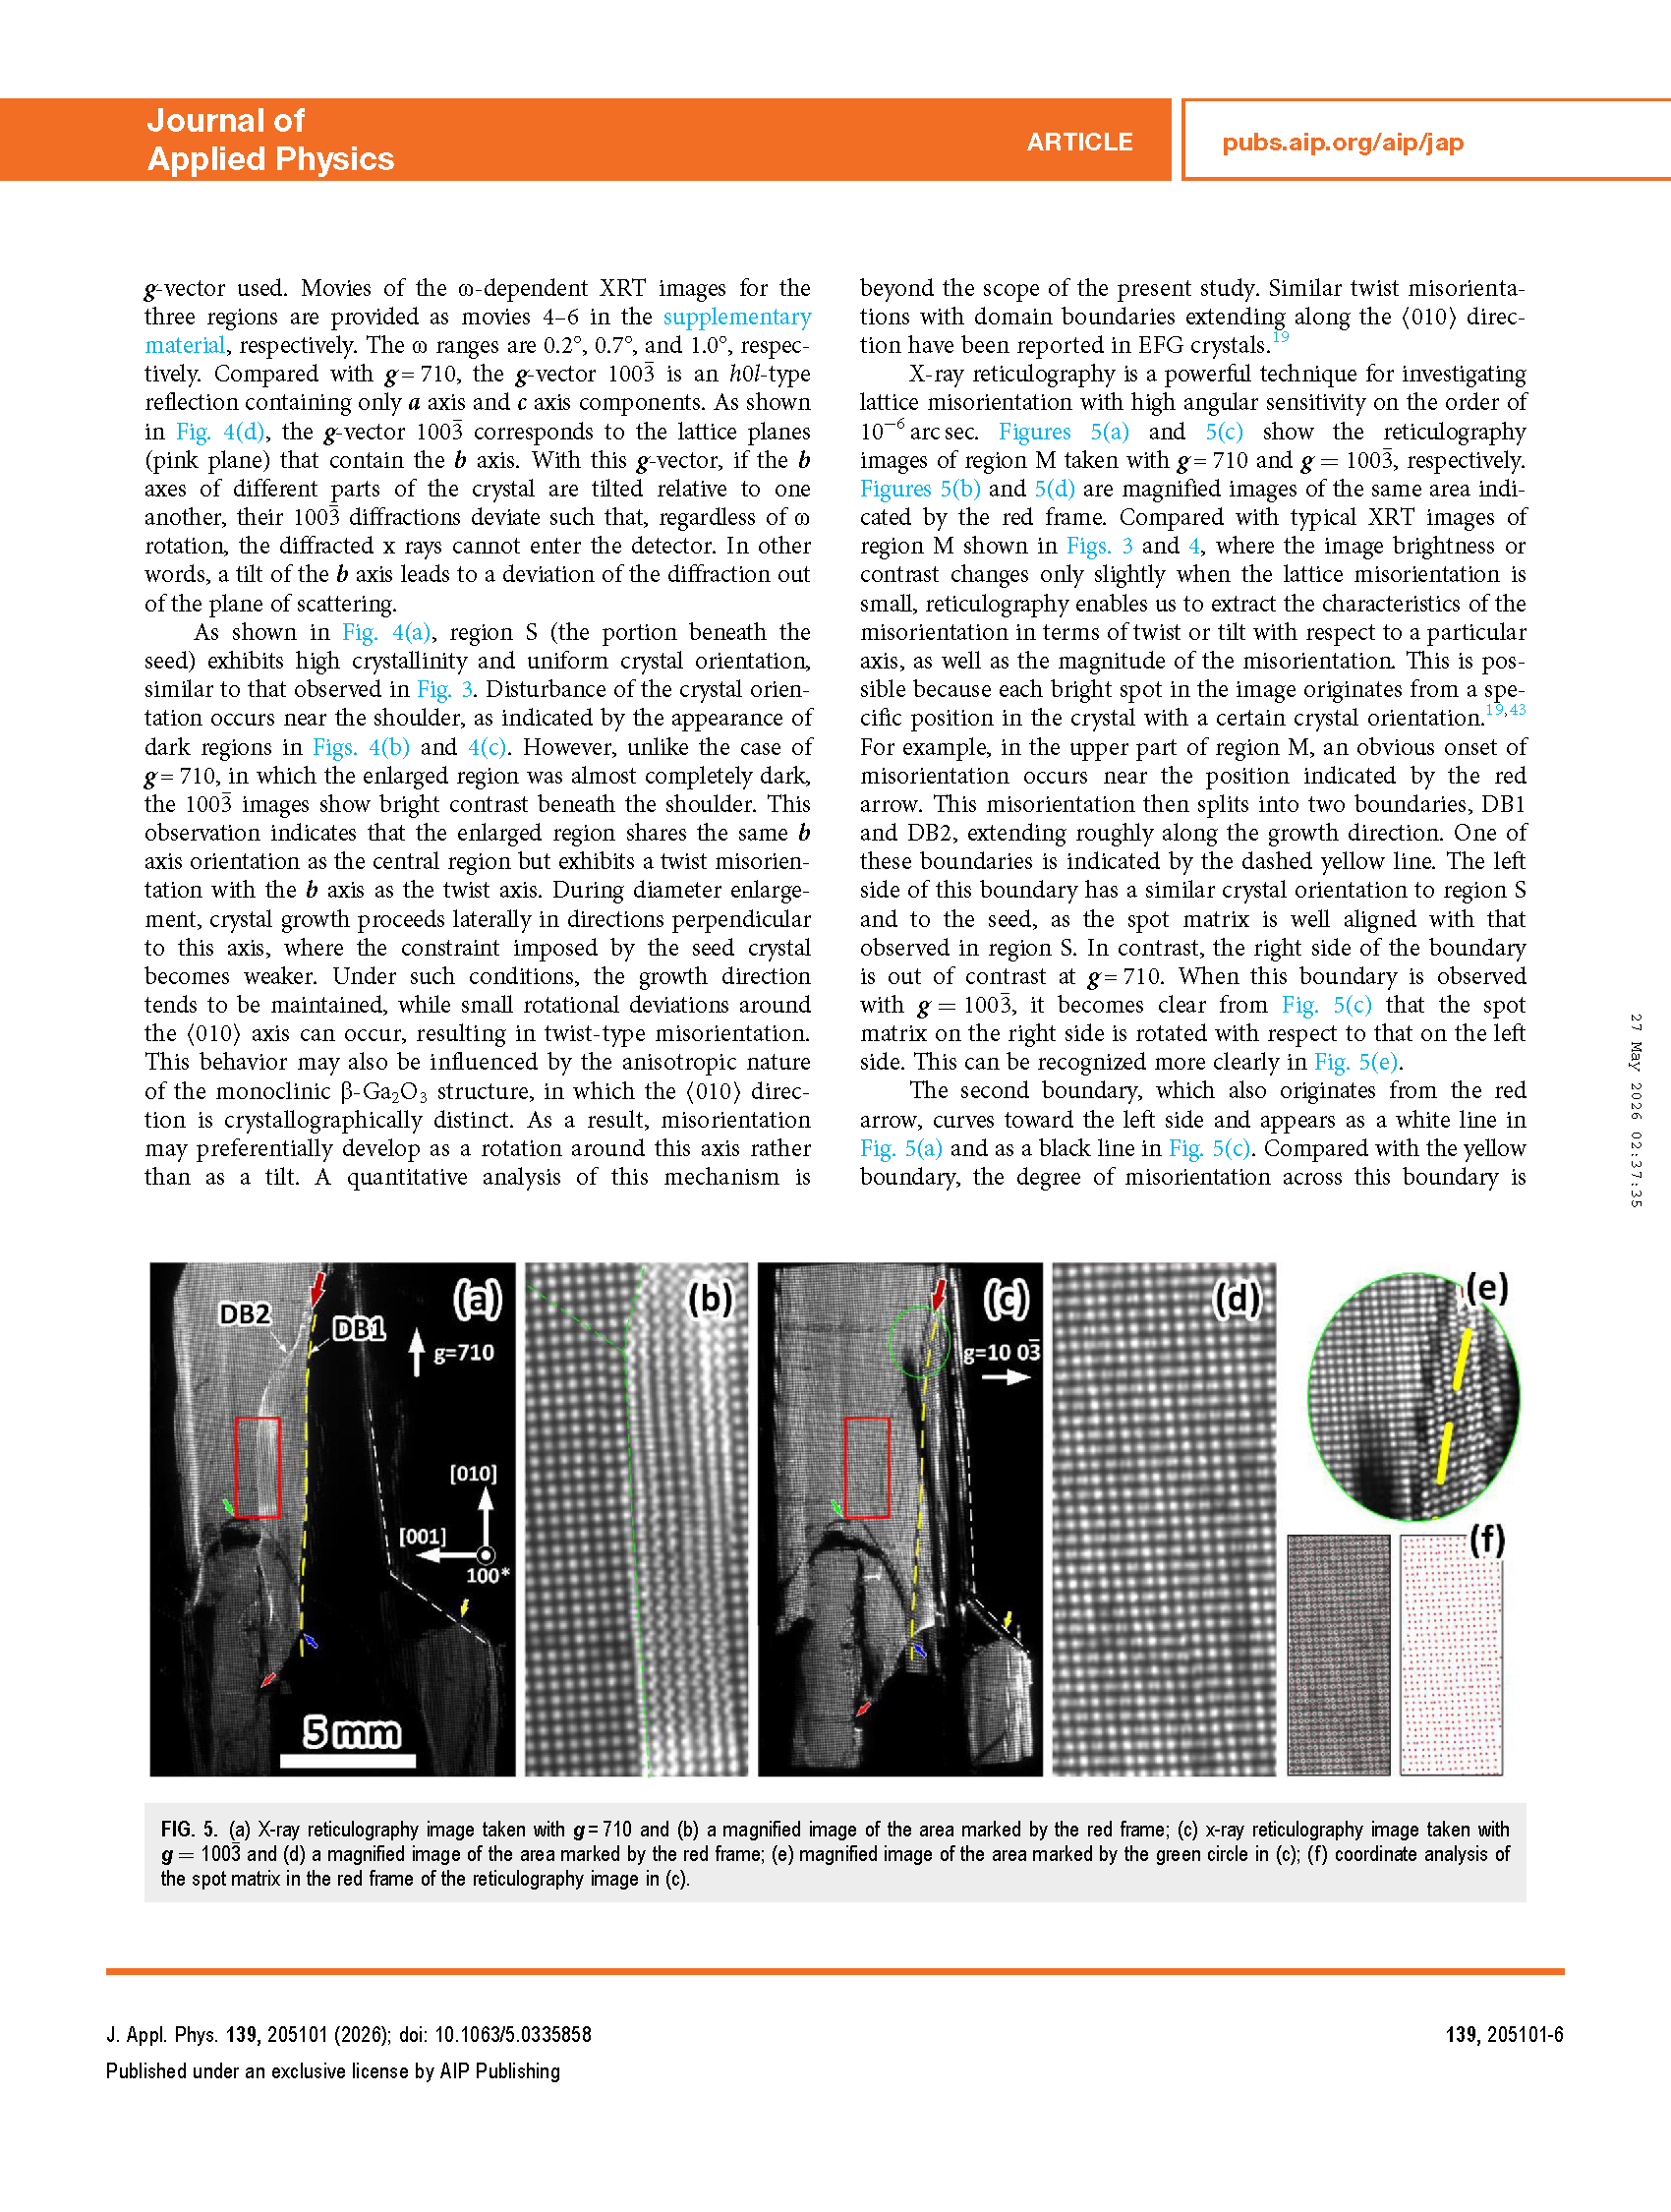
FIG. 5. (a) X-ray reticulography image taken with g=710 and (b) a magnified image of the area marked by the red frame; (c) x-ray reticulography image taken with g=100-3 and (d) a magnified image of the area marked by the red frame; (e) magnified image of the area marked by the green circle in (c); (f) coordinate analysis of the spot matrix in the red frame of the reticulography image in (c).
DOI:
doi.org/10.1063/5.0335858