


Researchers from Naval Research Laboratory have published a dissertation titled " Copper–vacancy center in gallium oxide: A telecom quantum defect " in Applied Physics Letters.
Background
Quantum defects have emerged as one of the most promising platforms for quantum information technologies. The spin states of these atomic-scale defects can serve as qubits that are optically initializable and readable, while single-photon emission from their optical transitions enables quantum networking and sensing applications.
The nitrogen-vacancy (NV−) center in diamond serves as the archetypal quantum defect. However, the performance of NV centers is limited by several factors: low photoluminescence weight in the zero-phonon line (ZPL) due to strong phonon coupling, emission wavelengths (637nm) far from telecom bands, and the challenges associated with diamond substrate availability and processing.
Wide-bandgap semiconductors provide ideal hosts for quantum defects by isolating defect states from band edge states. In particular, transition metal (TM) impurities in wide-bandgap semiconductors have recently gained attention as robust and controllable quantum defect candidates. Several TM ions, including Cr and V in SiC and Cr in AlN and GaN, have already demonstrated viability as optically addressable spin qubits, and recent first-principles work has extended this search to Cr defects in wide-bandgap oxides such as a-quartz.
Abstract
Quantum defects in wide-bandgap semiconductors have emerged as promising platforms for quantum information technologies, offering optically addressable spin states and single-photon emission. Defects emitting at telecom wavelengths are particularly attractive for quantum networking applications due to compatibility with existing fiber-optic infrastructure. Here, we employ first-principles calculations to identify a previously observed telecom emitter in β-Ga₂O₃ as a hydrogenated copper–vacancy center. We propose that previously observed emission at 1316nm arises from one of four hydrogenated copper–vacancy configurations. Through comparisons with earlier experimental characterization, including photoluminescence, photoluminescence excitation, and zero-field splitting, we conclude that the singly hydrogenated ib configuration is the most likely candidate. These centers exhibit spin-1 ground states with large zero-field splitting and strong zero- phonon emission lines: characteristics essential for quantum applications. Our results establish hydrogenated copper–vacancy centers in gallium oxide as promising telecom quantum defects and provide a roadmap for engineering quantum emitters in wide-bandgap oxides.
Conclusion
In summary, our first-principles calculations identify hydrogenated copper–vacancy centers in β-Ga₂O₃ as the source of the 1316nm telecom emission. We propose four candidate structures: Hᵢ−Cu −VⁱᵇGa, 2Hᵢ−Cu−VⁱᵇGa, Hᵢ−Cu−VⁱᶜGa, and 2Hᵢ−Cu−VⁱᶜGa. Among these, Hᵢ−Cu−VⁱᵇGa is the most likely candidate: its photoluminescence spectrum, ZPL energy, and ZFS parameters are all in good agreement with experiment, and the active Cu³⁺ charge state is accessible under the published experimental conditions. The other three configurations are also plausible and may coexist in copper-doped β-Ga₂O₃.
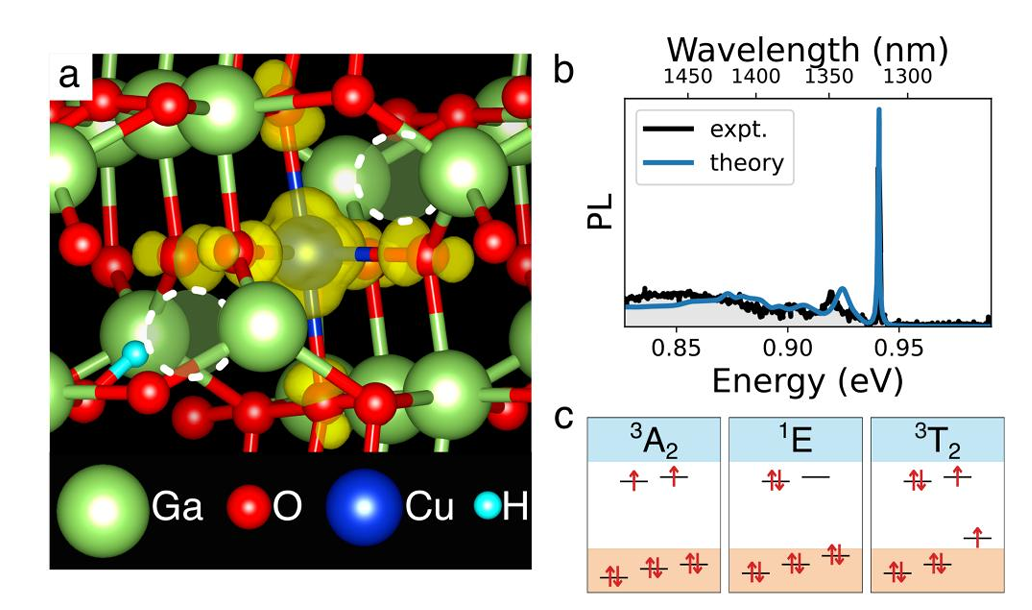
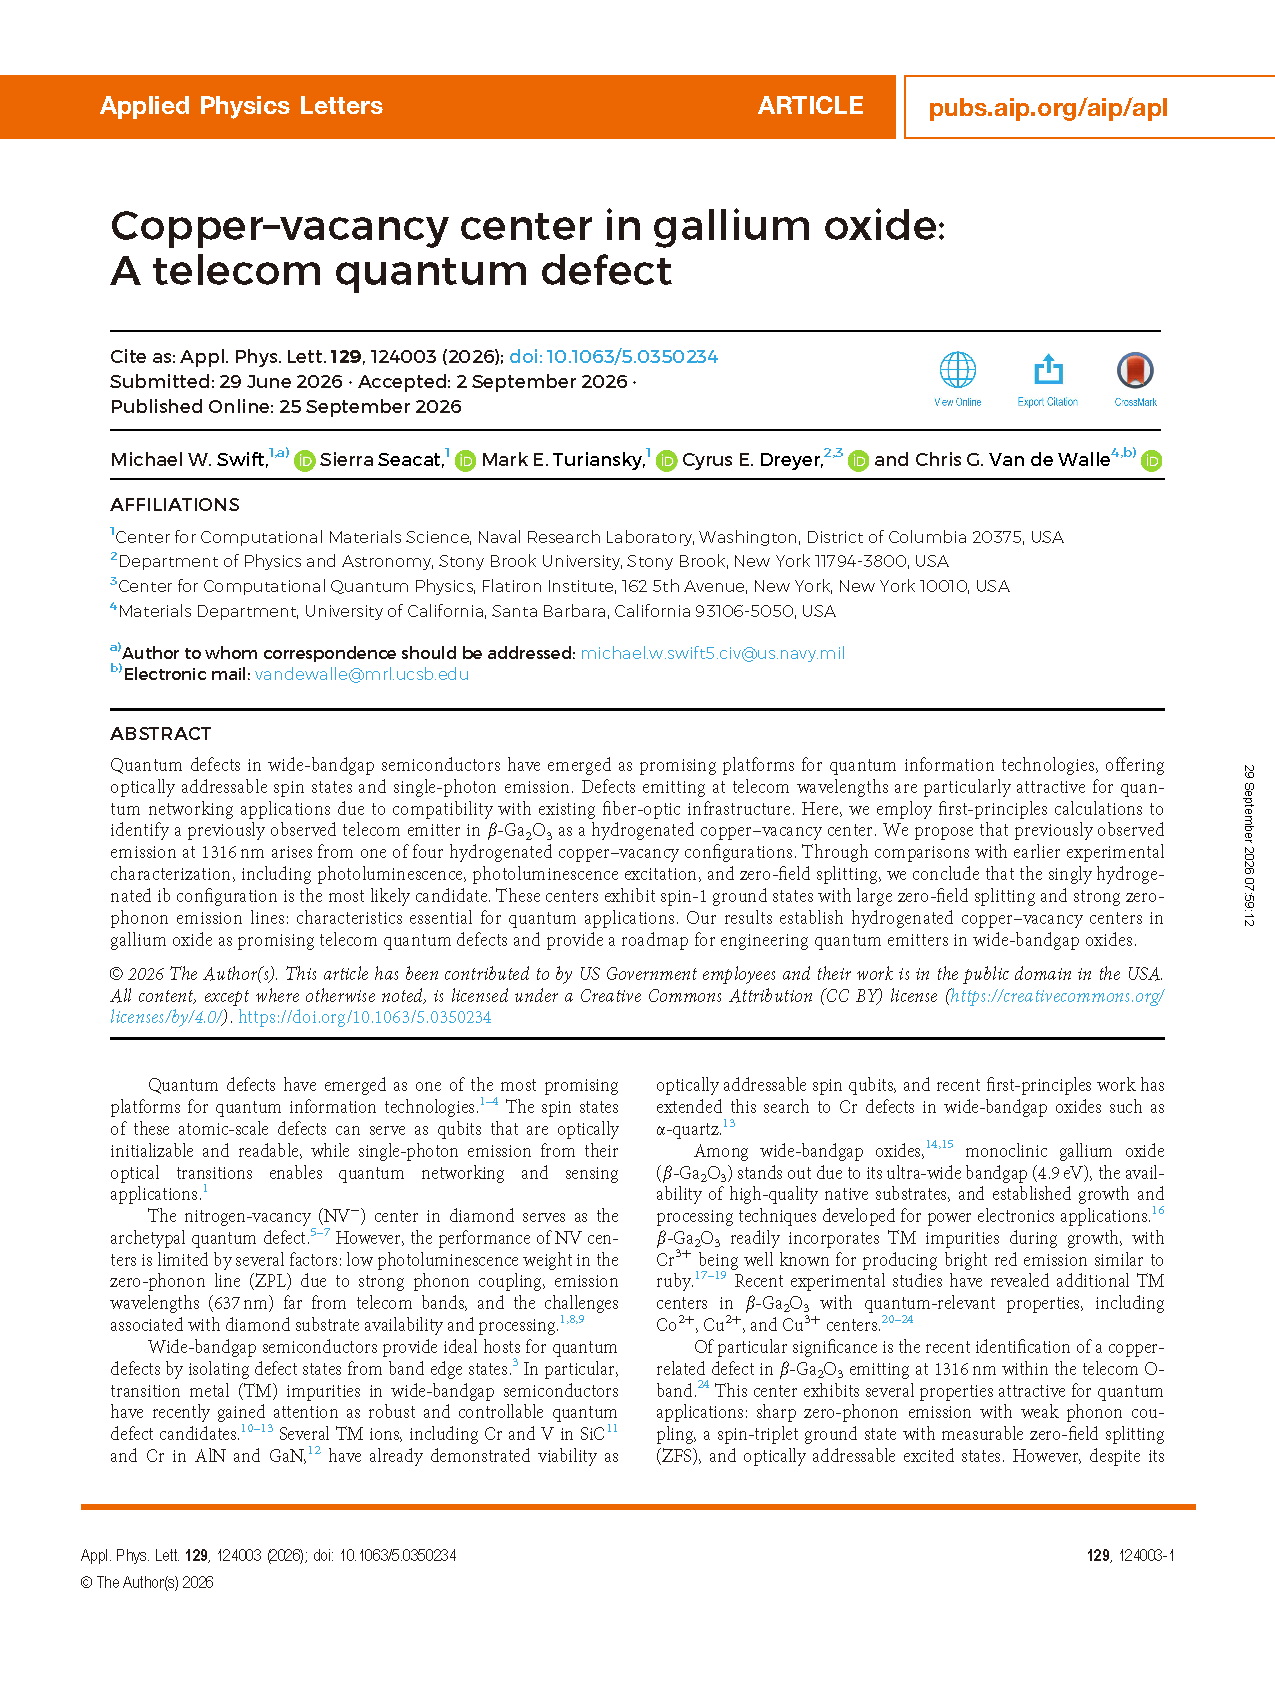
FIG. 1. Hydrogenated copper–vacancy centers in β-Ga₂O₃. (a) Visualization of the singly hydrogenated copper–vacancy center (Hᵢ−Cu−VⁱᵇGa) in its active charge state, 2−. Elements are color-coded as shown below the visualization. Gallium vacancies on the tetrahedral sites adjacent to the copper are shown with dotted outlines. The charge-density isosurface of the two holes in the 3A2 ground-state configuration is shown in yellow. (b) Experimental PL from Ref. compared with our calculated PL for Hᵢ−Cu−VⁱᵇGa associated with the first excited state. The theoretical spectrum has been shifted to match the experimental ZPL. (c) Sketch illustrating the occupation of the lower t2g triplet and upper eg doublet in the ground state (3A2), first excited state (1E), and second excited state (3T2) within the bandgap of β-Ga₂O₃.
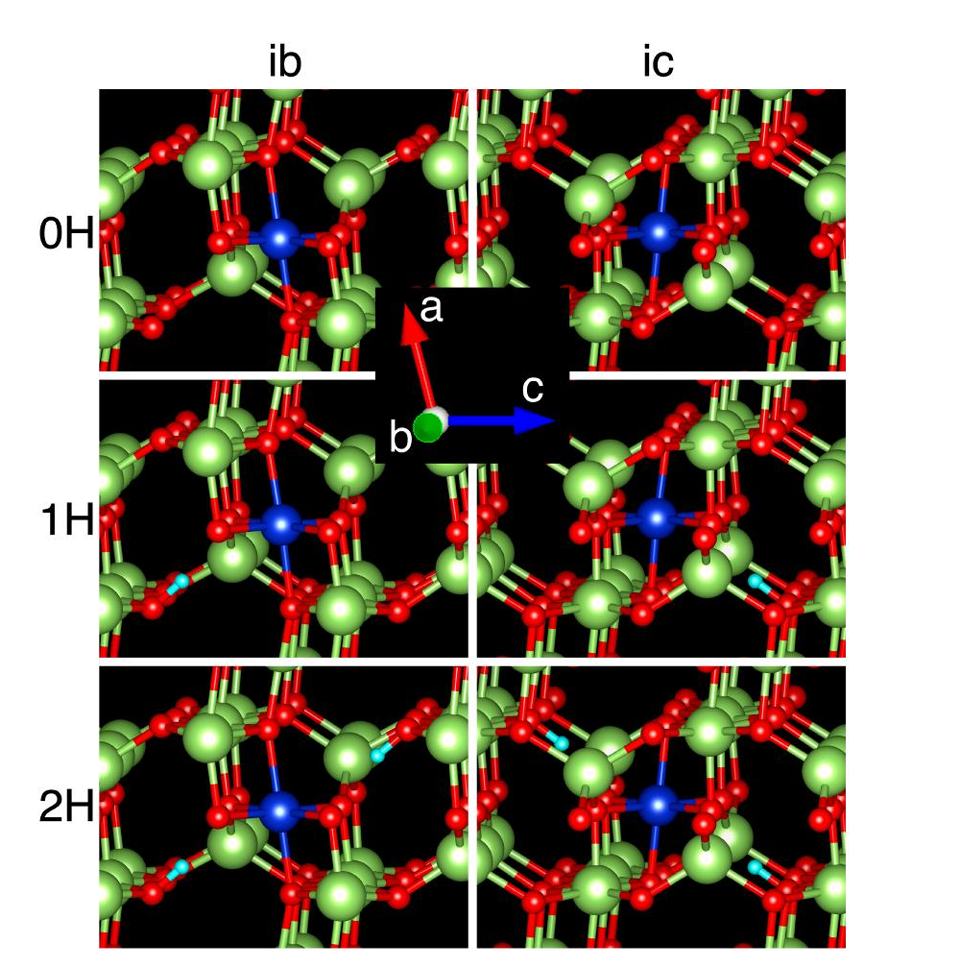
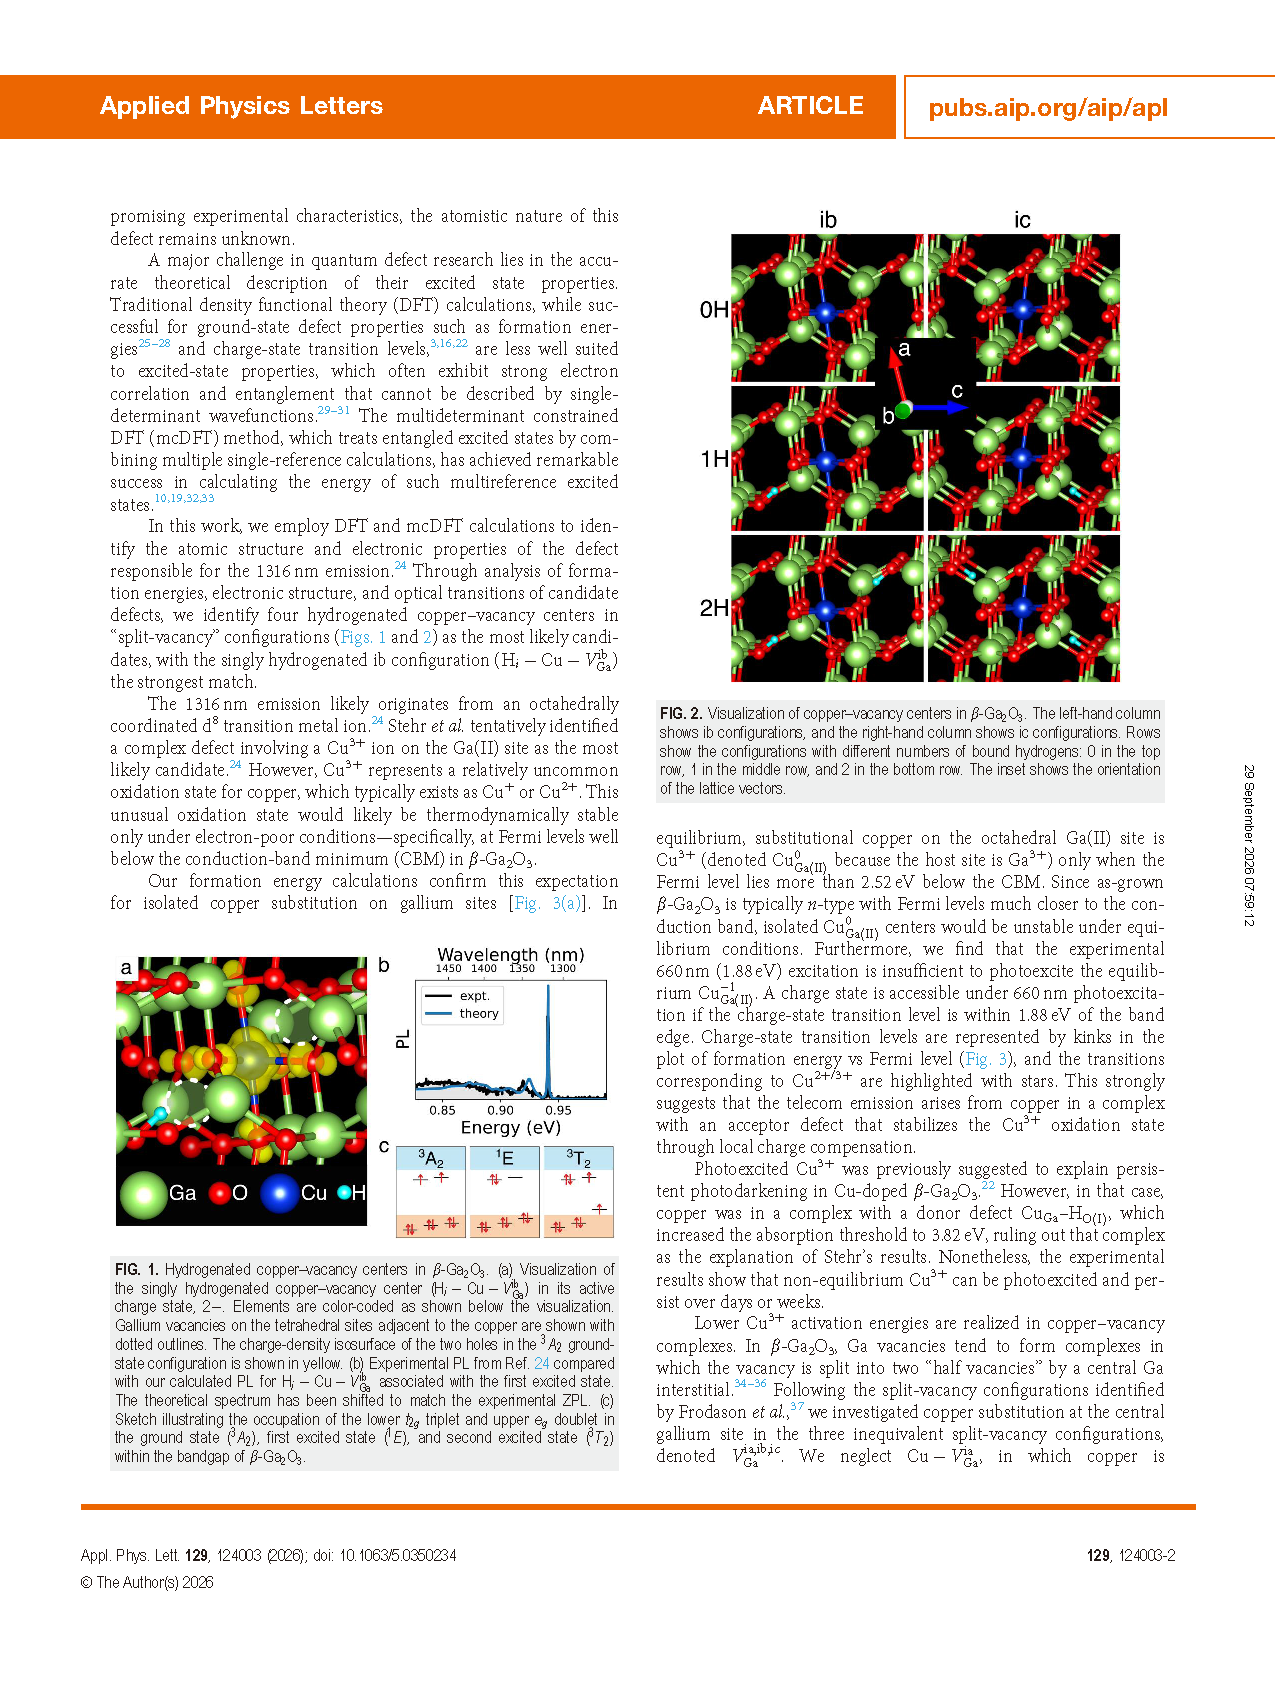
FIG. 2. Visualization of copper–vacancy centers in β-Ga₂O₃. The left-hand column shows ib configurations, and the right-hand column shows ic configurations. Rows show the configurations with different numbers of bound hydrogens: 0 in the top row, 1 in the middle row, and 2 in the bottom row. The inset shows the orientation of the lattice vectors.
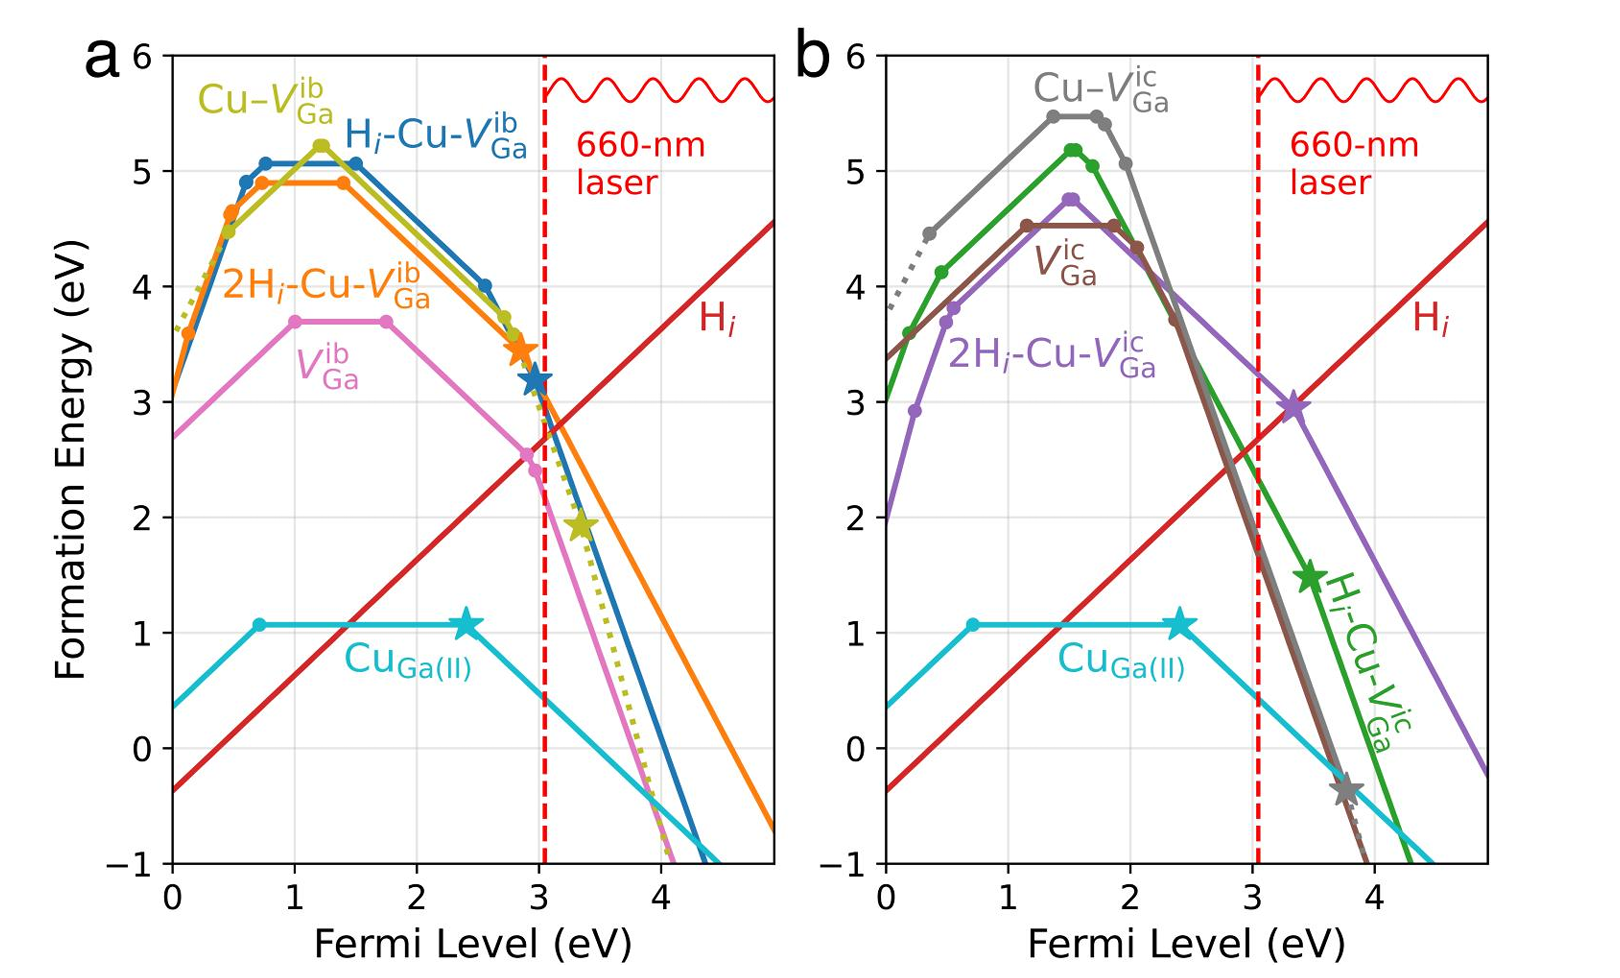
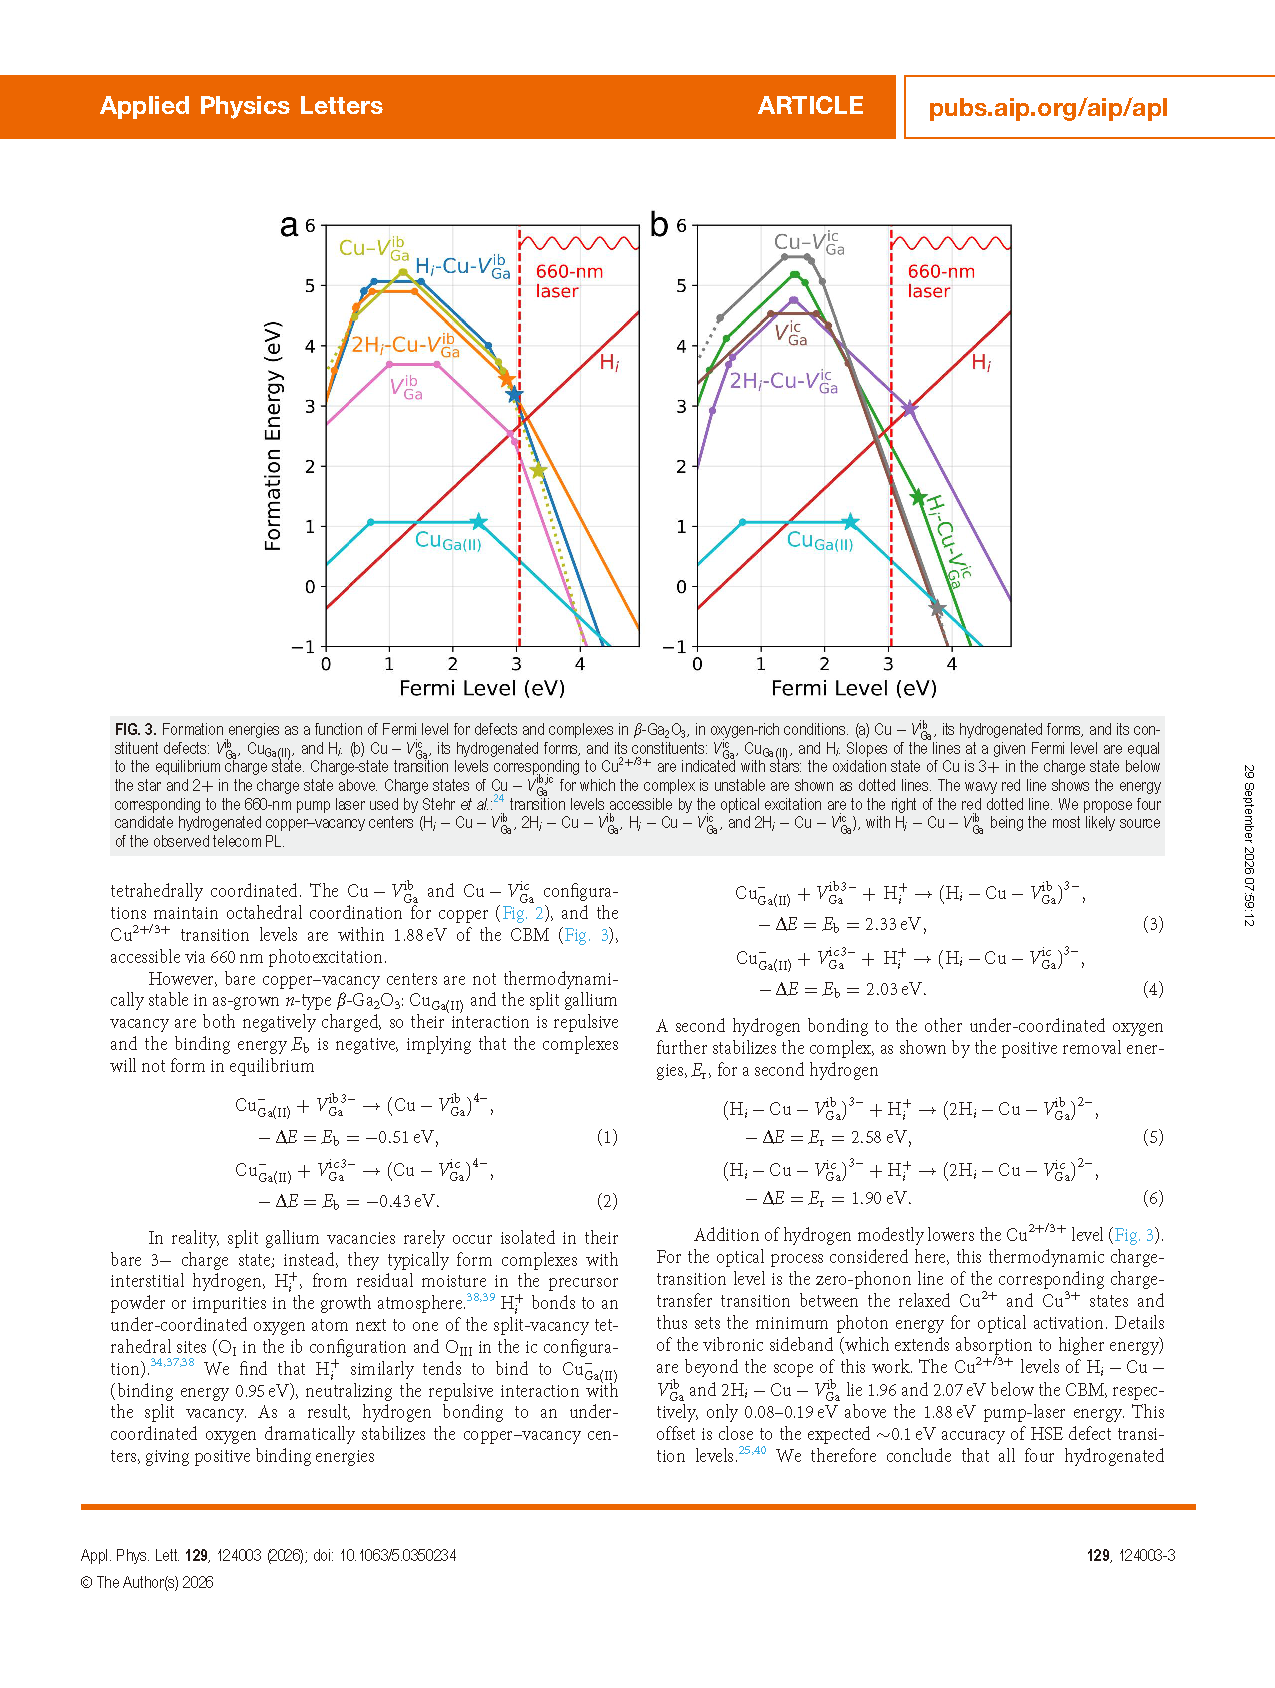
FIG. 3. Formation energies as a function of Fermi level for defects and complexes in β-Ga₂O₃, in oxygen-rich conditions. (a) Cu−VⁱᵇGa, its hydrogenated forms, and its constituent defects: VⁱᵇGa, CuGa(II), and Hi. (b) Cu−VⁱᶜGa, its hydrogenated forms, and its constituents: VⁱᶜGa, CuGa(II), and Hi. Slopes of the lines at a given Fermi level are equal to the equilibrium charge state. Charge-state transition levels corresponding to Cu2+/3+ indicated with stars: the oxidation state of Cu is 3+ the charge state below the star and 2+ the charge state above. Charge states of Cu−Vⁱᵇ,icGa for which the complex is unstable are shown as dotted lines. The wavy red line shows the energy corresponding to the 660-nm pump laser used by Stehr et al.: transition levels accessible by the optical excitation are to the right of the red dotted line. We propose four candidate hydrogenated copper–vacancy centers (Hᵢ−Cu−VⁱᵇGa, 2Hᵢ−Cu−VⁱᵇGa, Hᵢ−Cu−VⁱᶜGa, and 2Hᵢ−Cu−VⁱᶜGa), with Hᵢ−Cu−VⁱᵇGa being the most likely source of the observed telecom PL.
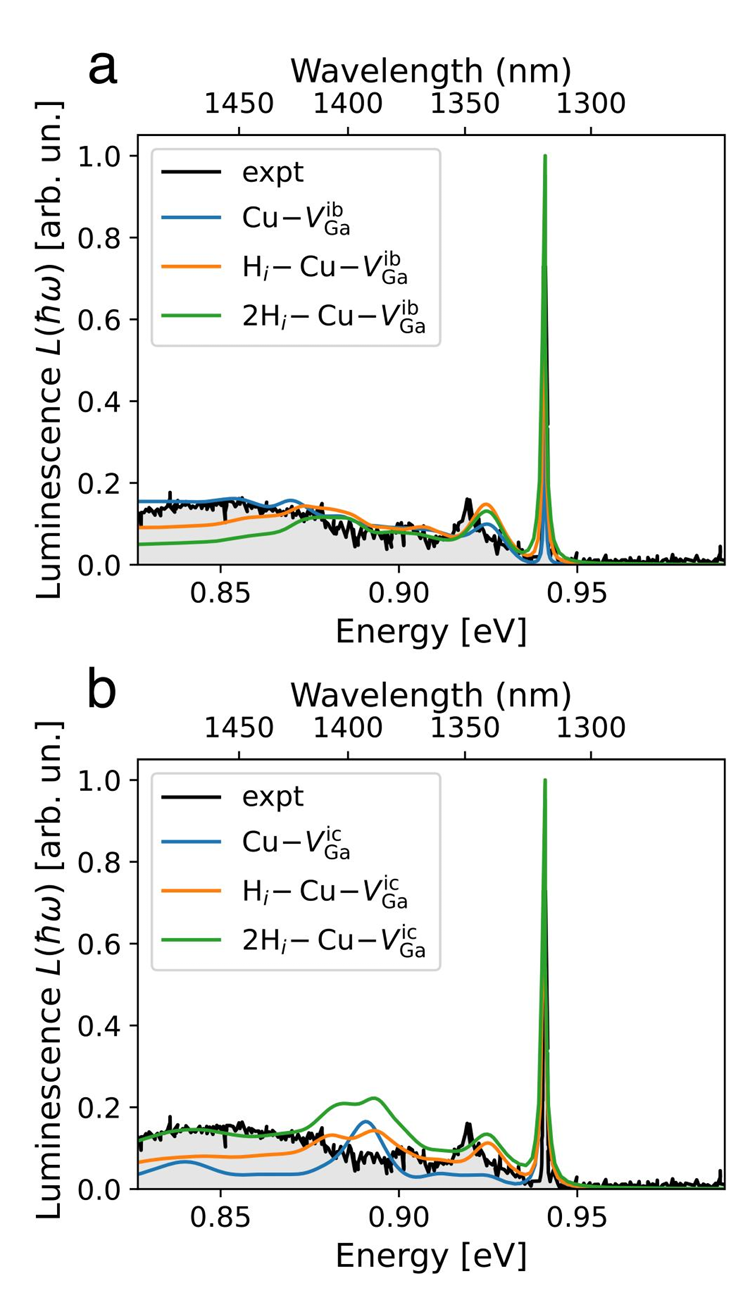
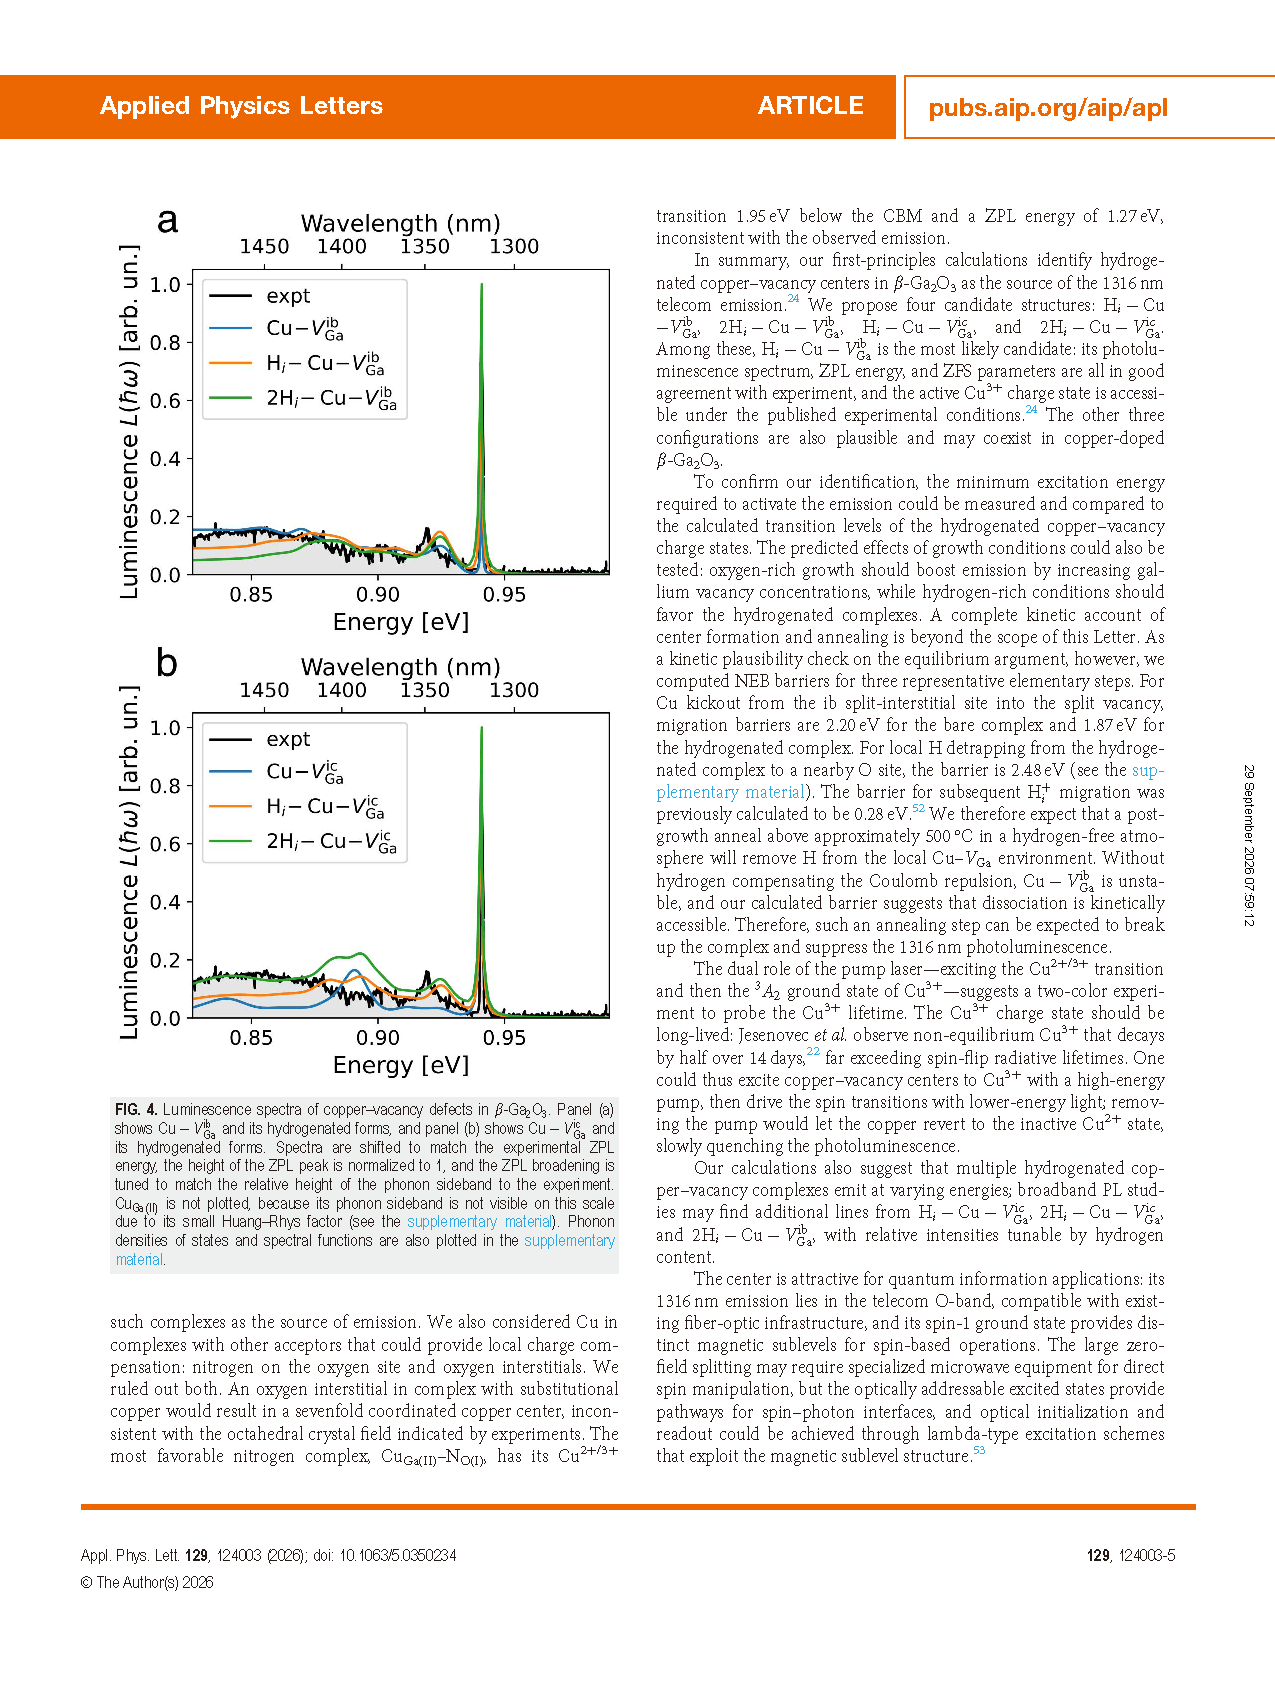
FIG. 4. Luminescence spectra of copper–vacancy defects in β-Ga₂O₃. Panel (a) shows Cu−VⁱᵇGa and its hydrogenated forms, and panel (b) shows Cu−VⁱᶜGa and its hydrogenated forms. Spectra are shifted to match the experimental ZPL energy, the height of the ZPL peak is normalized to 1, and the ZPL broadening is tuned to match the relative height of the phonon sideband to the experiment. CuGa(II) is not plotted, because its phonon sideband is not visible on this scale due to its small Huang–Rhys factor (see the supplementary material). Phonon densities of states and spectral functions are also plotted in the supplementary material.
DOI:
doi.org/10.1063/5.0350234
Instruction
Official Account

Cooperation
Top