Paper Sharing
【Member Papers】Hong Kong University Science and Technology (Guangzhou) --- Exploration of p-type conductivity in β-Ga₂O₃ through Se-Mg hyper co-doped: An ion implantation approach
日期:2025-03-10阅读:1006
Researchers from the Hong Kong University of Science and Technology (Guangzhou) have published a dissertation titled "Exploration of p-type conductivity in β-Ga2O3 through Se-Mg hyper co-doped: An ion implantation approach" in Materials Today Advances.
Abstract
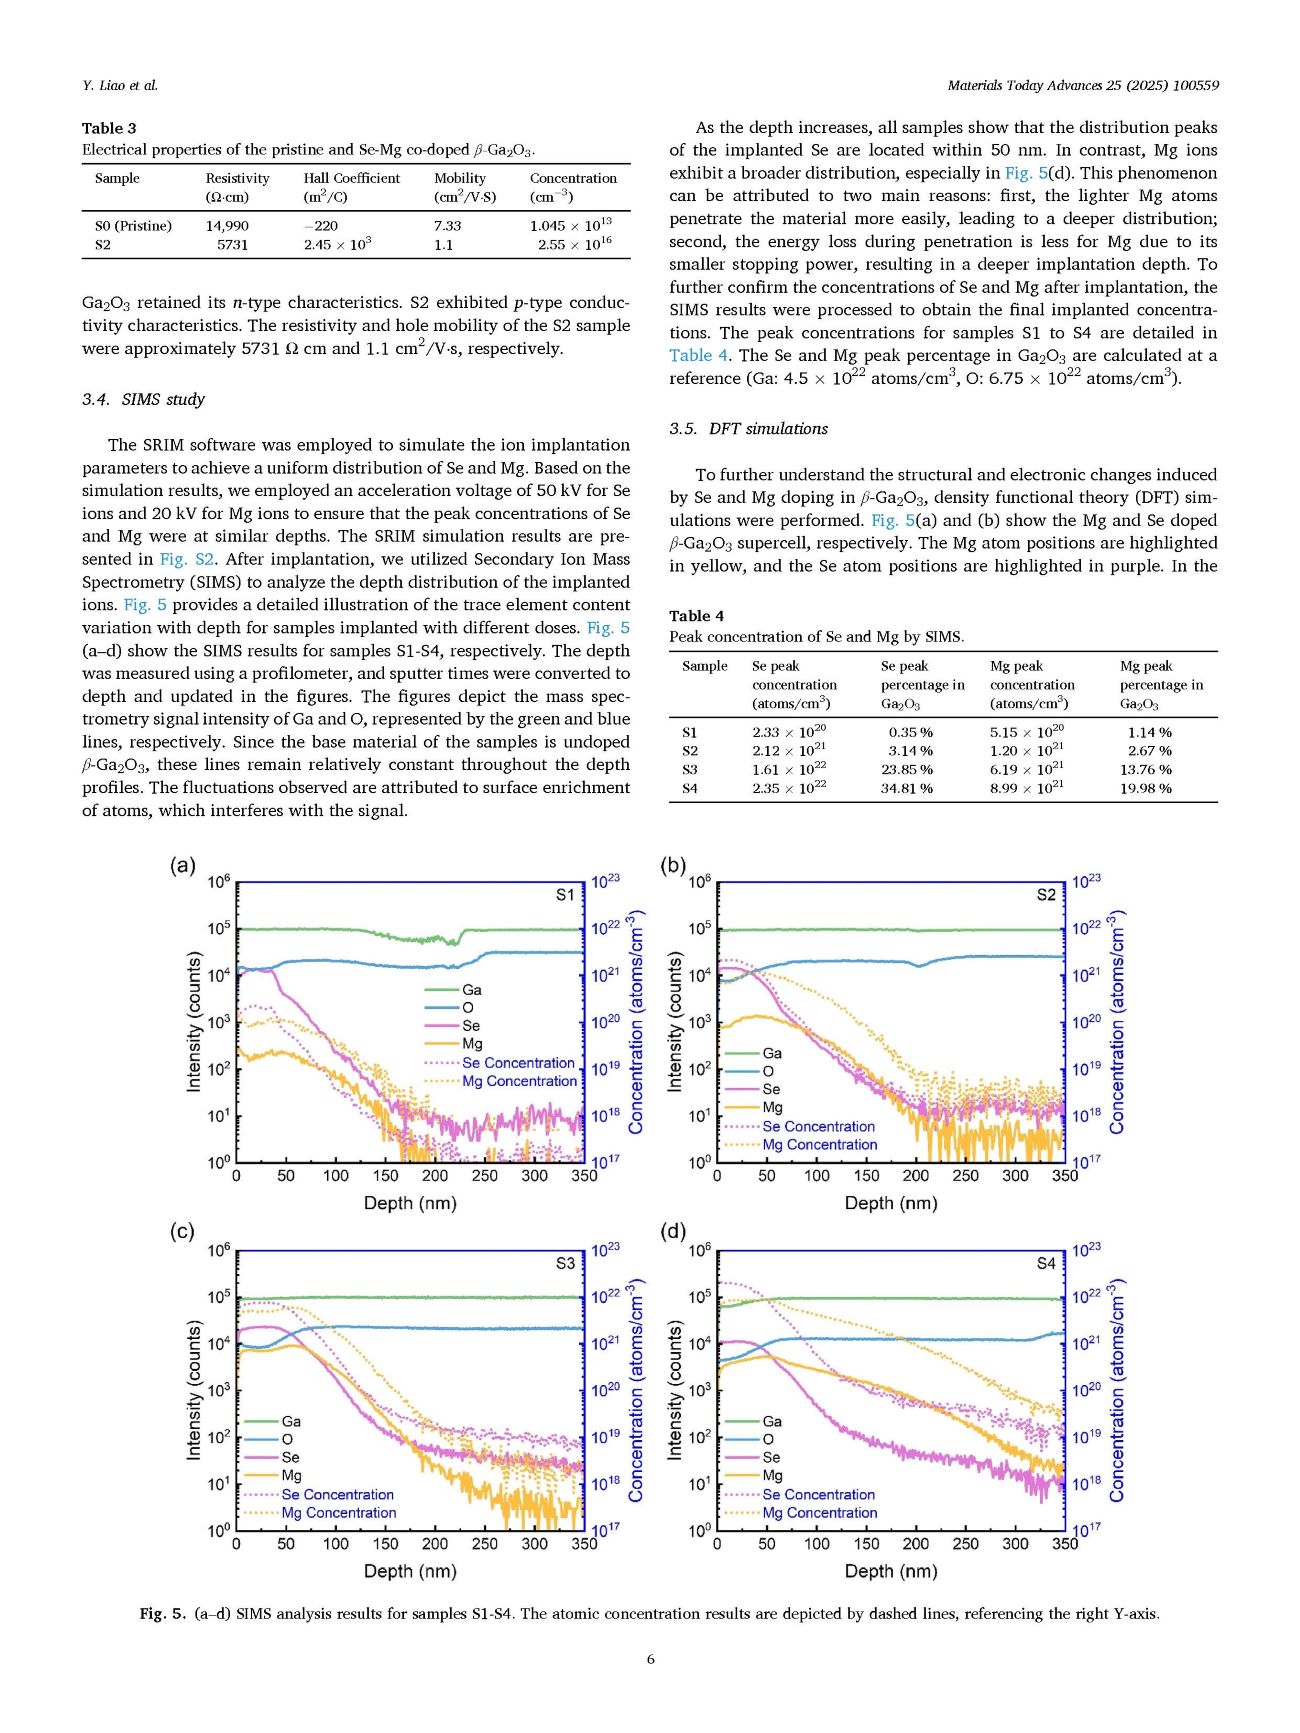
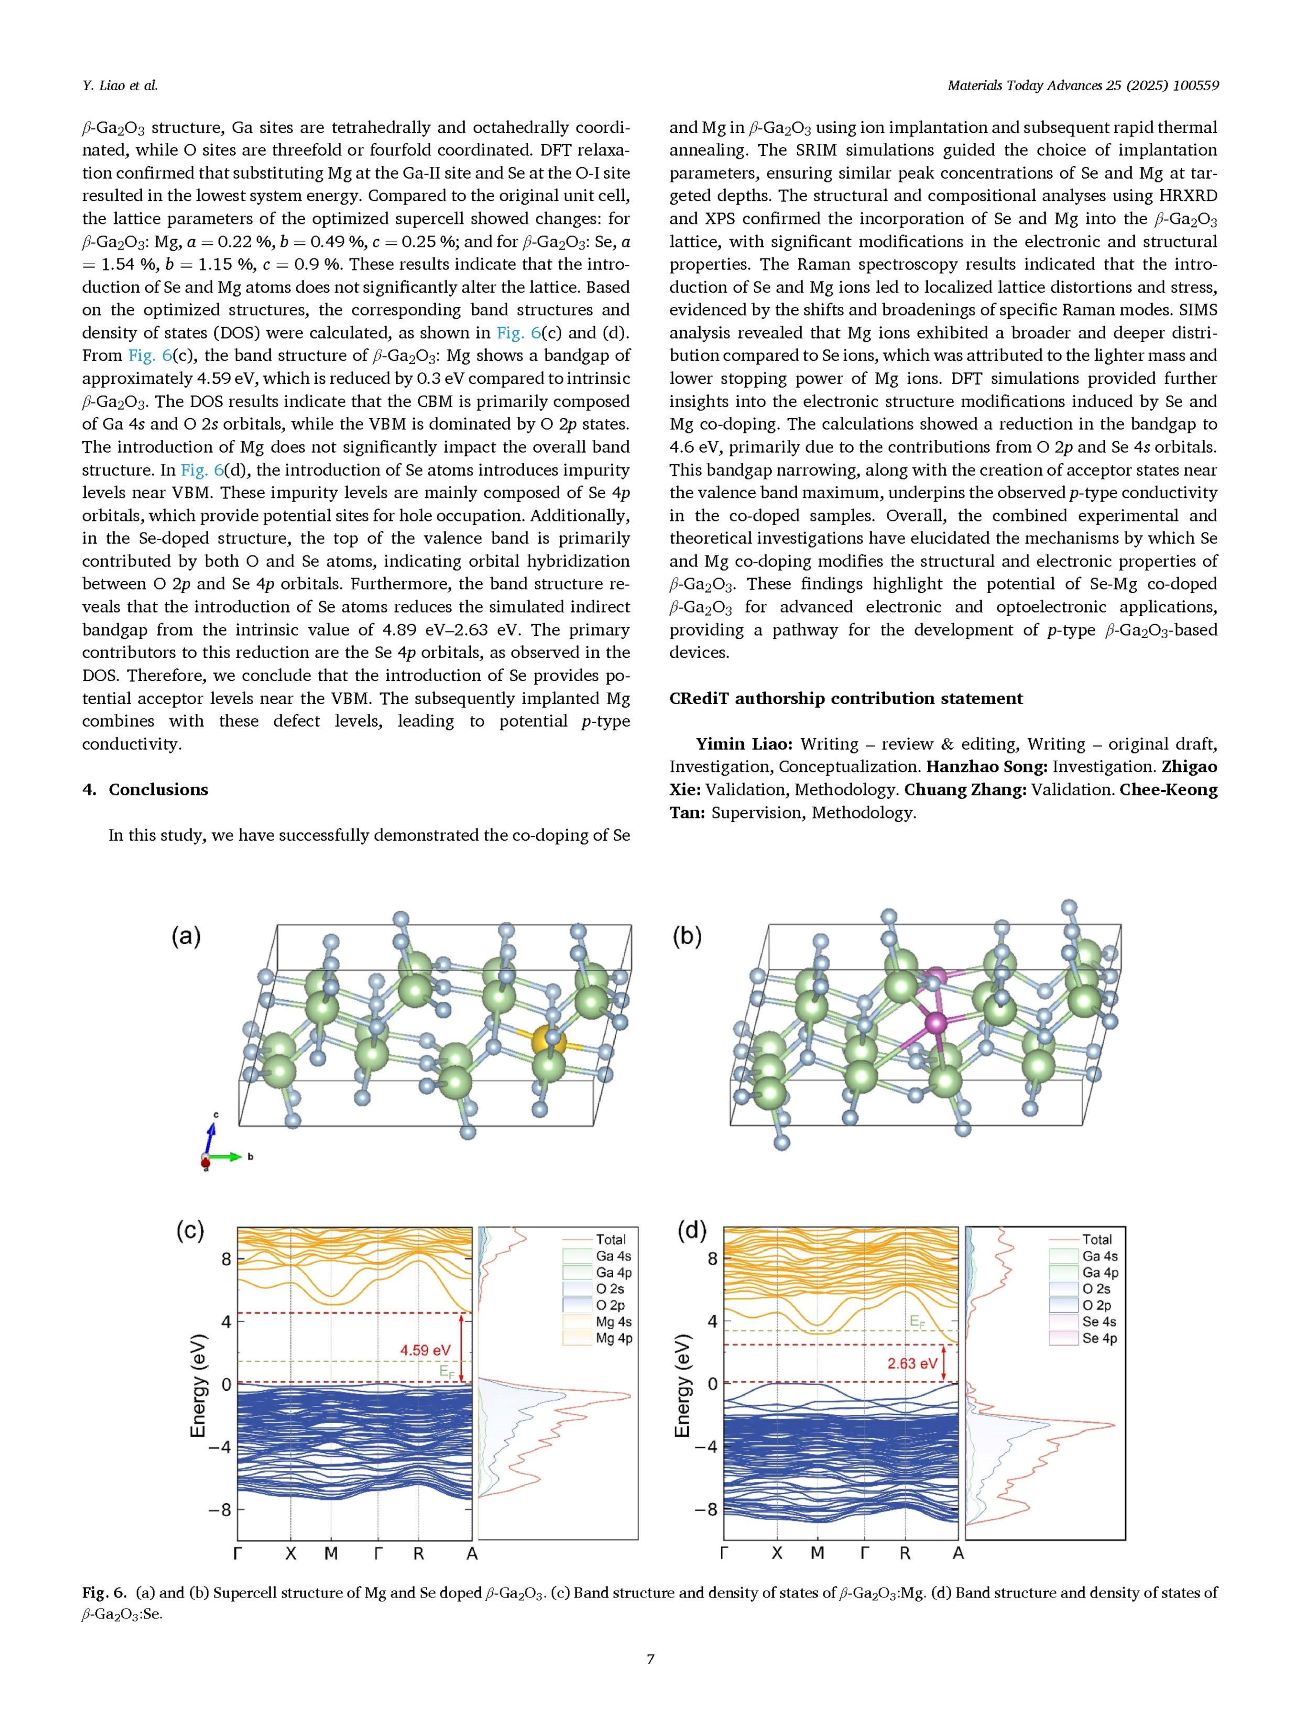
As β-Ga2O3 continues to advance, achieving stable p-type doping has become a key research focus. This study proposes a method to introduce defect energy levels near the conduction band and acceptor doping elements to achieve p-type doped β-Ga2O3. We utilized ion implantation to achieve co-doped Ga2O3 with Se and Mg elements, employing a 50 kV acceleration voltage to reach a peak purity concentration depth. The concentrations of Se and Mg were quantified, with the highest concentrations reaching 2.35 × 10²²/cm3 (Se) and 8.99 × 10²¹/cm3 (Mg), consistent with simulation results. After implantation, the Se-Mg co-doped β-Ga2O3 underwent rapid thermal annealing at 850 °C in an oxygen environment to mitigate implantation damage. By adjusting the Se and Mg implantation dose, we could slightly tune the bandgap from 4.42 to 4.37 eV. Experimental characteristics revealed valence band maximum values and exhibited potential p-type behavior achieved by Se-Mg co-doping. Hall measurements indicated probable p-type conductivity. However, further verification is required. Additionally, first-principles density functional theory simulations provided calculations of substitutional defect formation energies and Fermi levels within the β-Ga2O3 lattice, further elucidating the causes of electronic structure changes induced by doping.
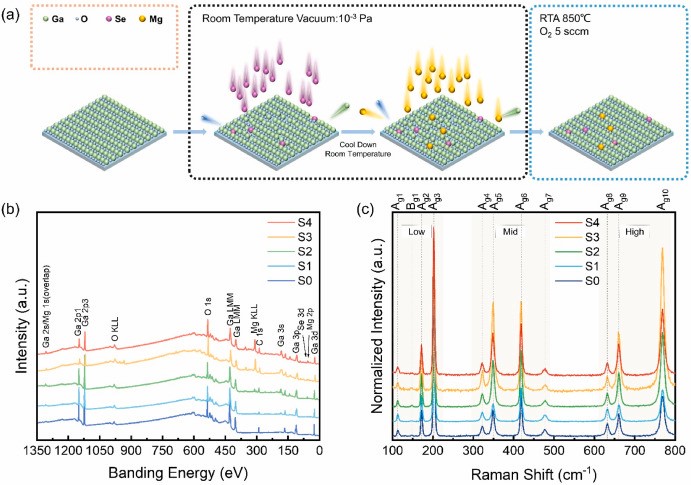
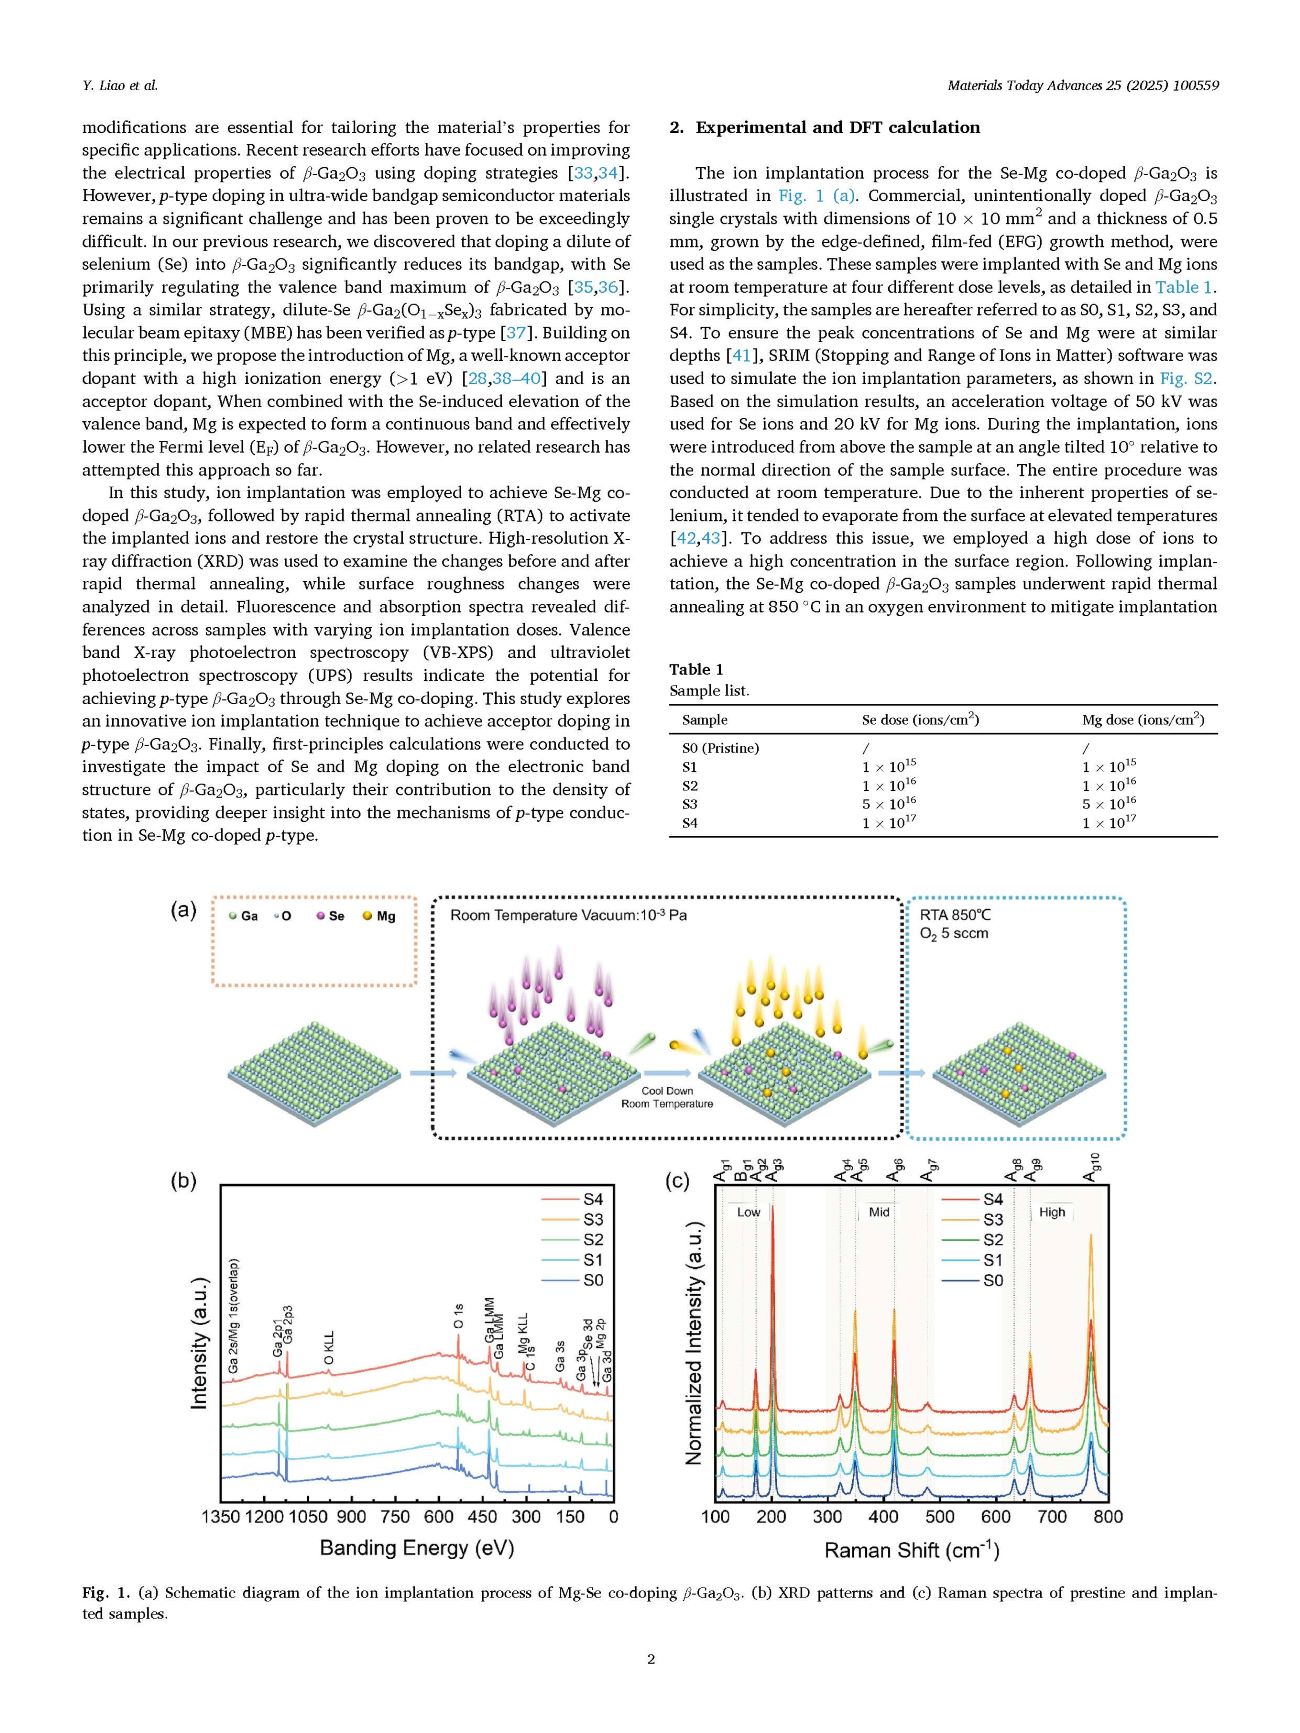
Fig. 1. (a) Schematic diagram of the ion implantation process of Mg-Se co-doping β-Ga2O3. (b) XRD patterns and (c) Raman spectra of prestine and implanted samples.
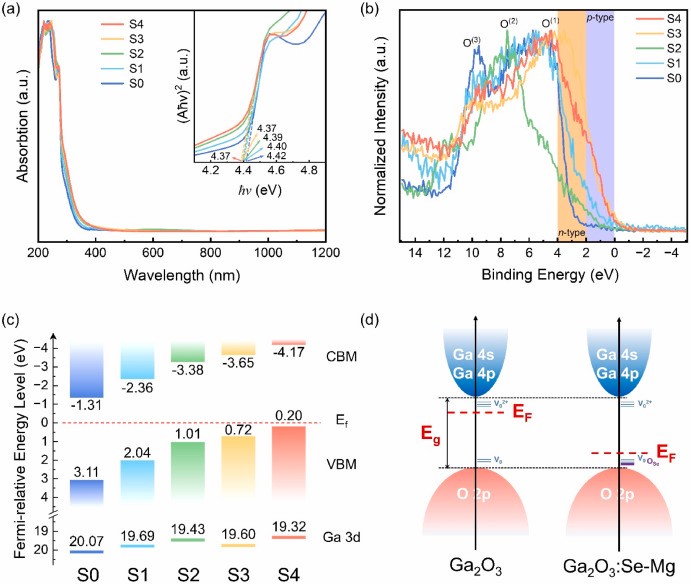
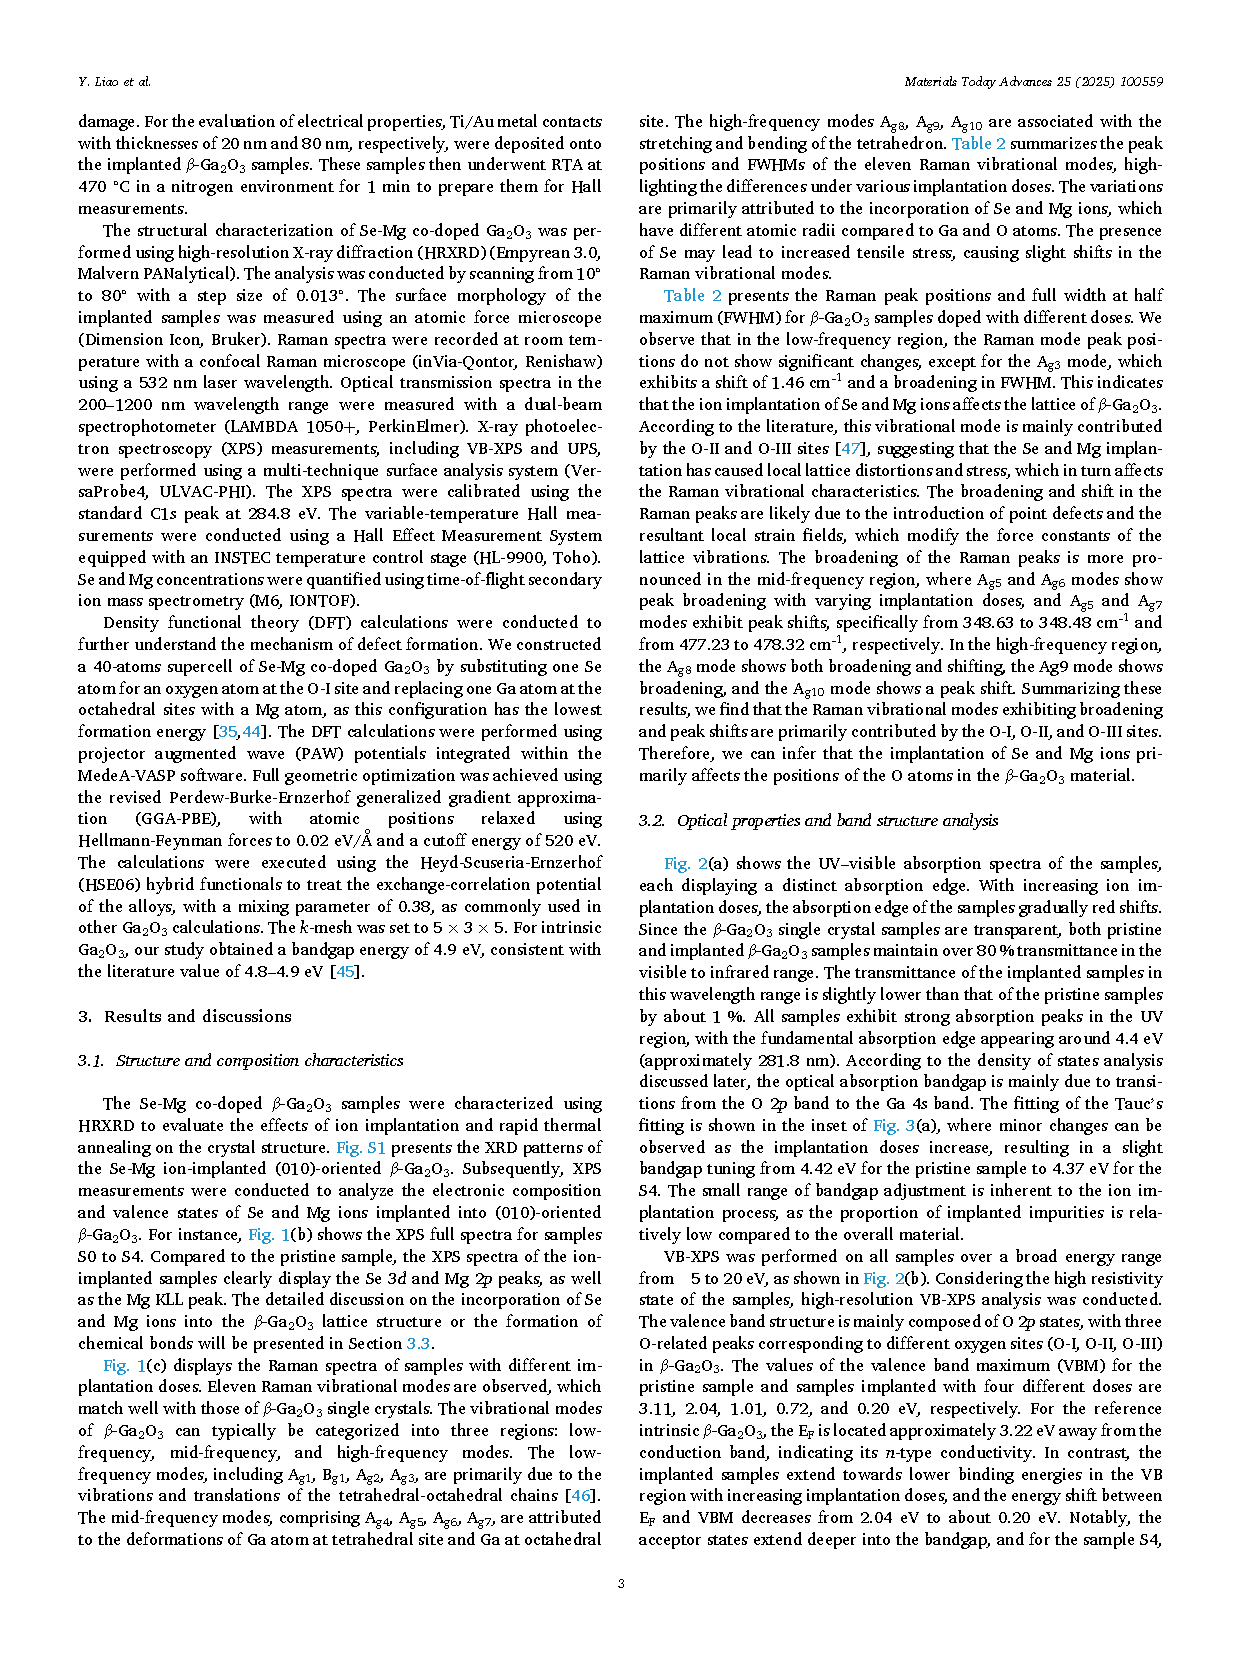
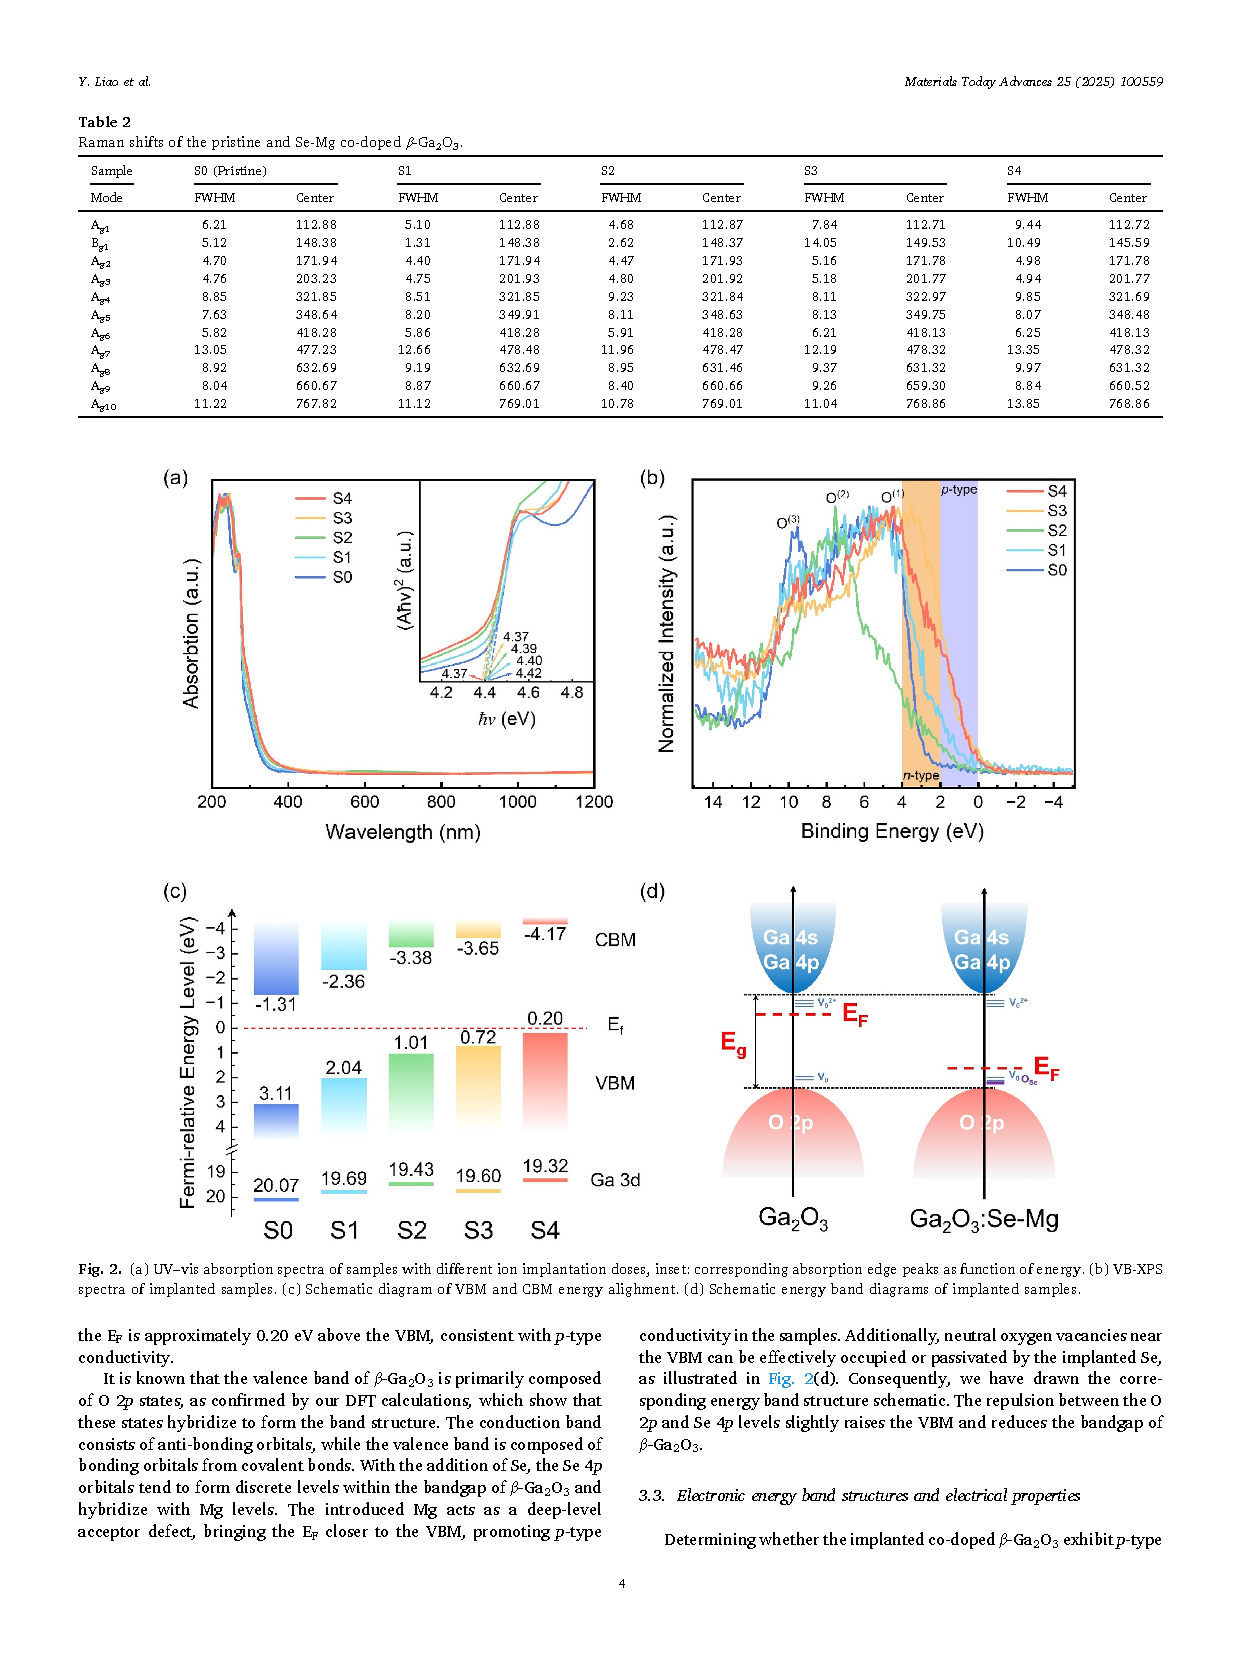
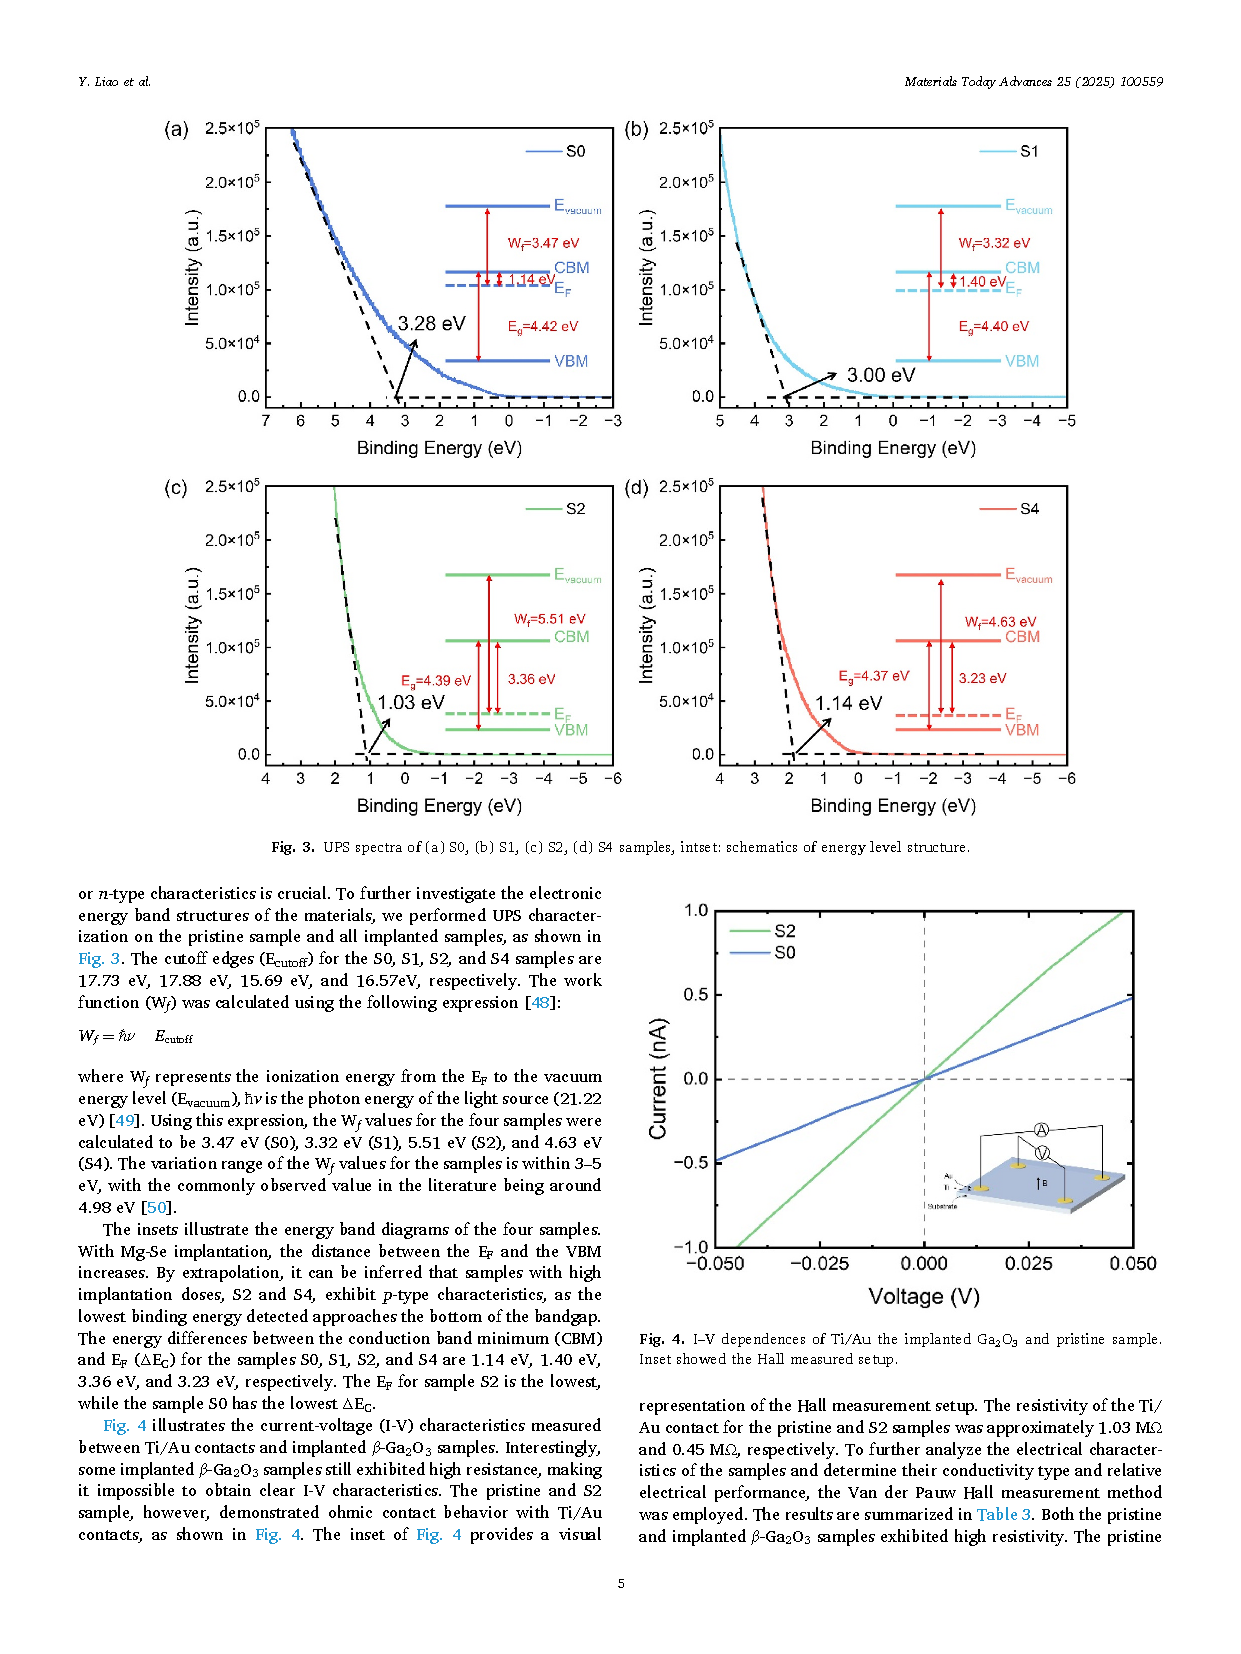
Fig. 2. (a) UV–vis absorption spectra of samples with different ion implantation doses, inset: corresponding absorption edge peaks as function of energy. (b) VB-XPS spectra of implanted samples. (c) Schematic diagram of VBM and CBM energy alighment. (d) Schematic energy band diagrams of implanted samples.
DOI:
doi.org/10.1016/j.mtadv.2025.100559