Paper Sharing
【International Papers】High-temperature annealing induced electrical compensation in UID and Sn doped β-Ga₂O₃ bulk samples: The role of VGa–Sn complexes
日期:2025-03-13阅读:916
Researchers from the Sorbonne Université have published a dissertation titled " High-temperature annealing induced electrical compensation in UID and Sn doped β-Ga2O3 bulk samples: The role of VGa–Sn complexes " in Journal of Applied Physics.
Abstract
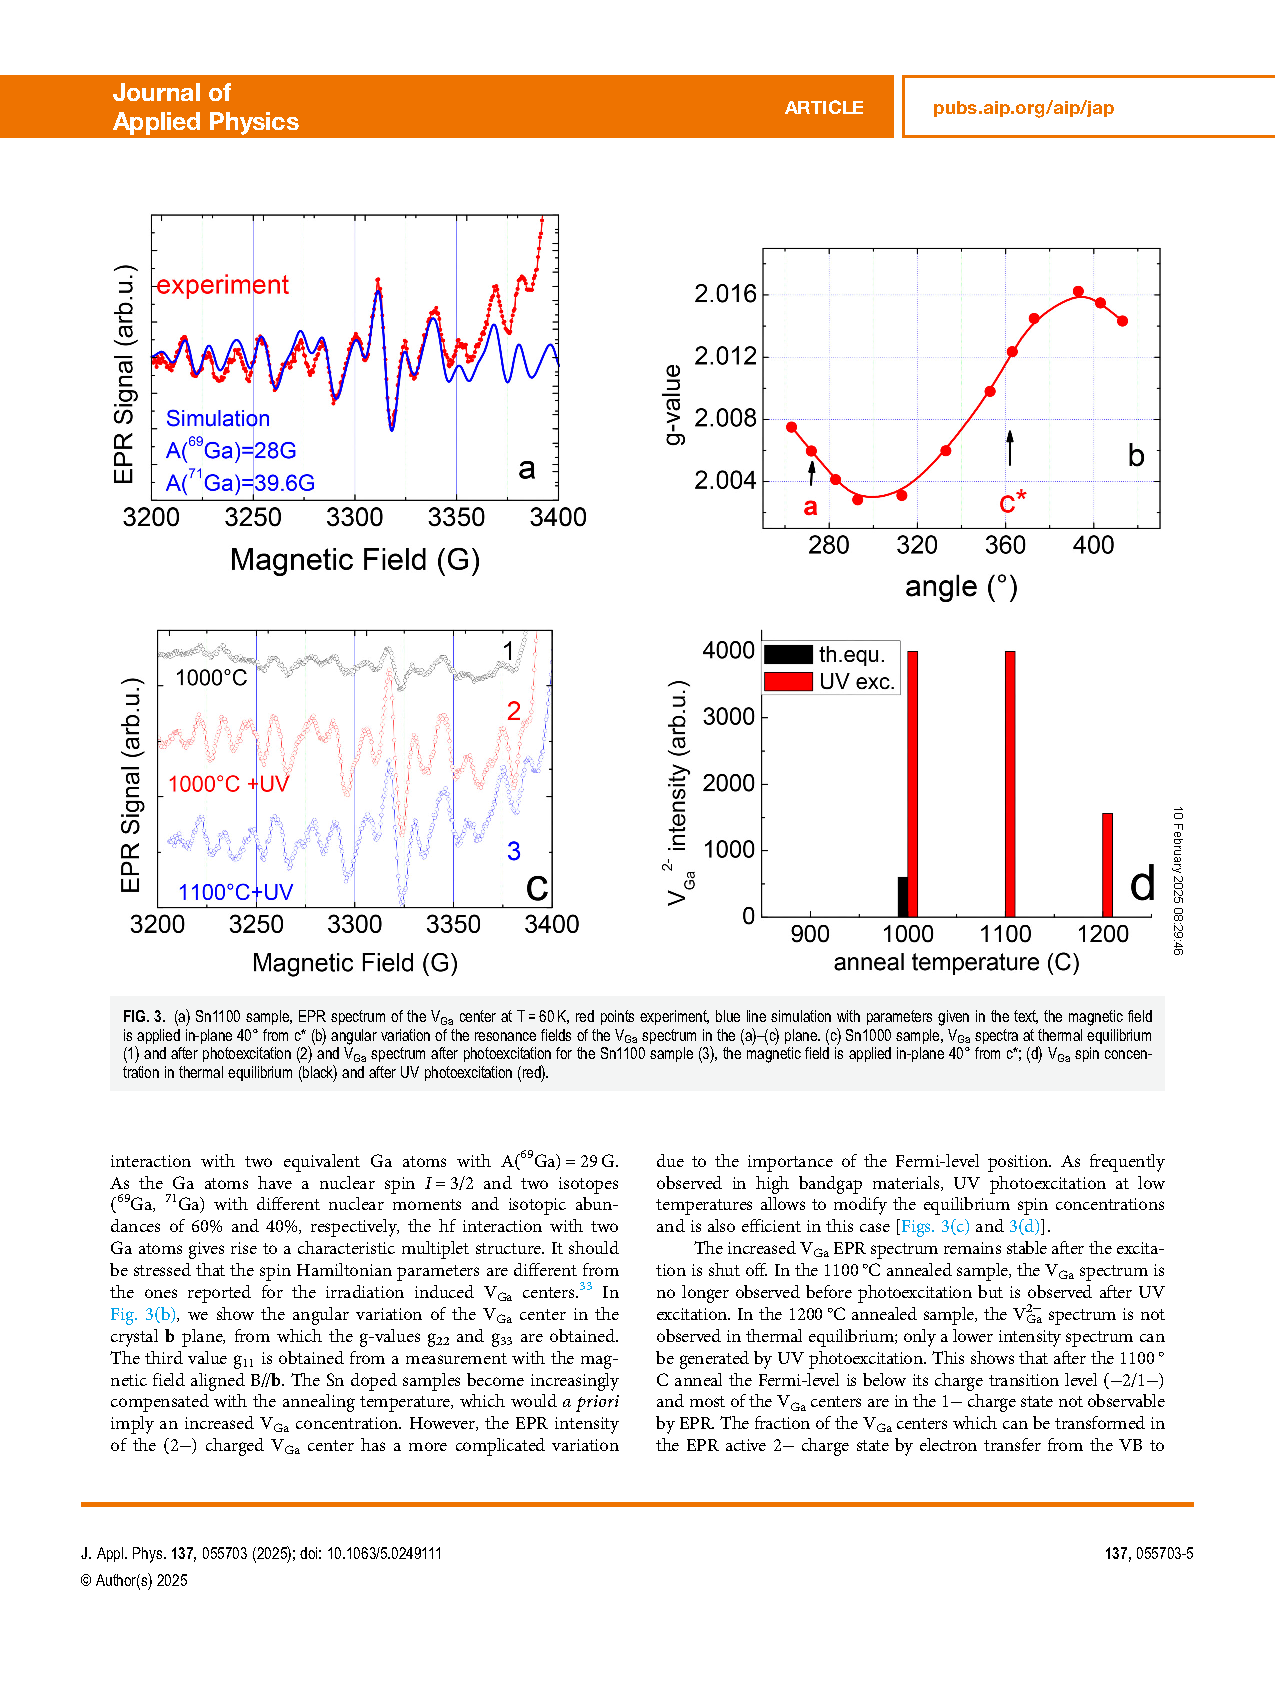
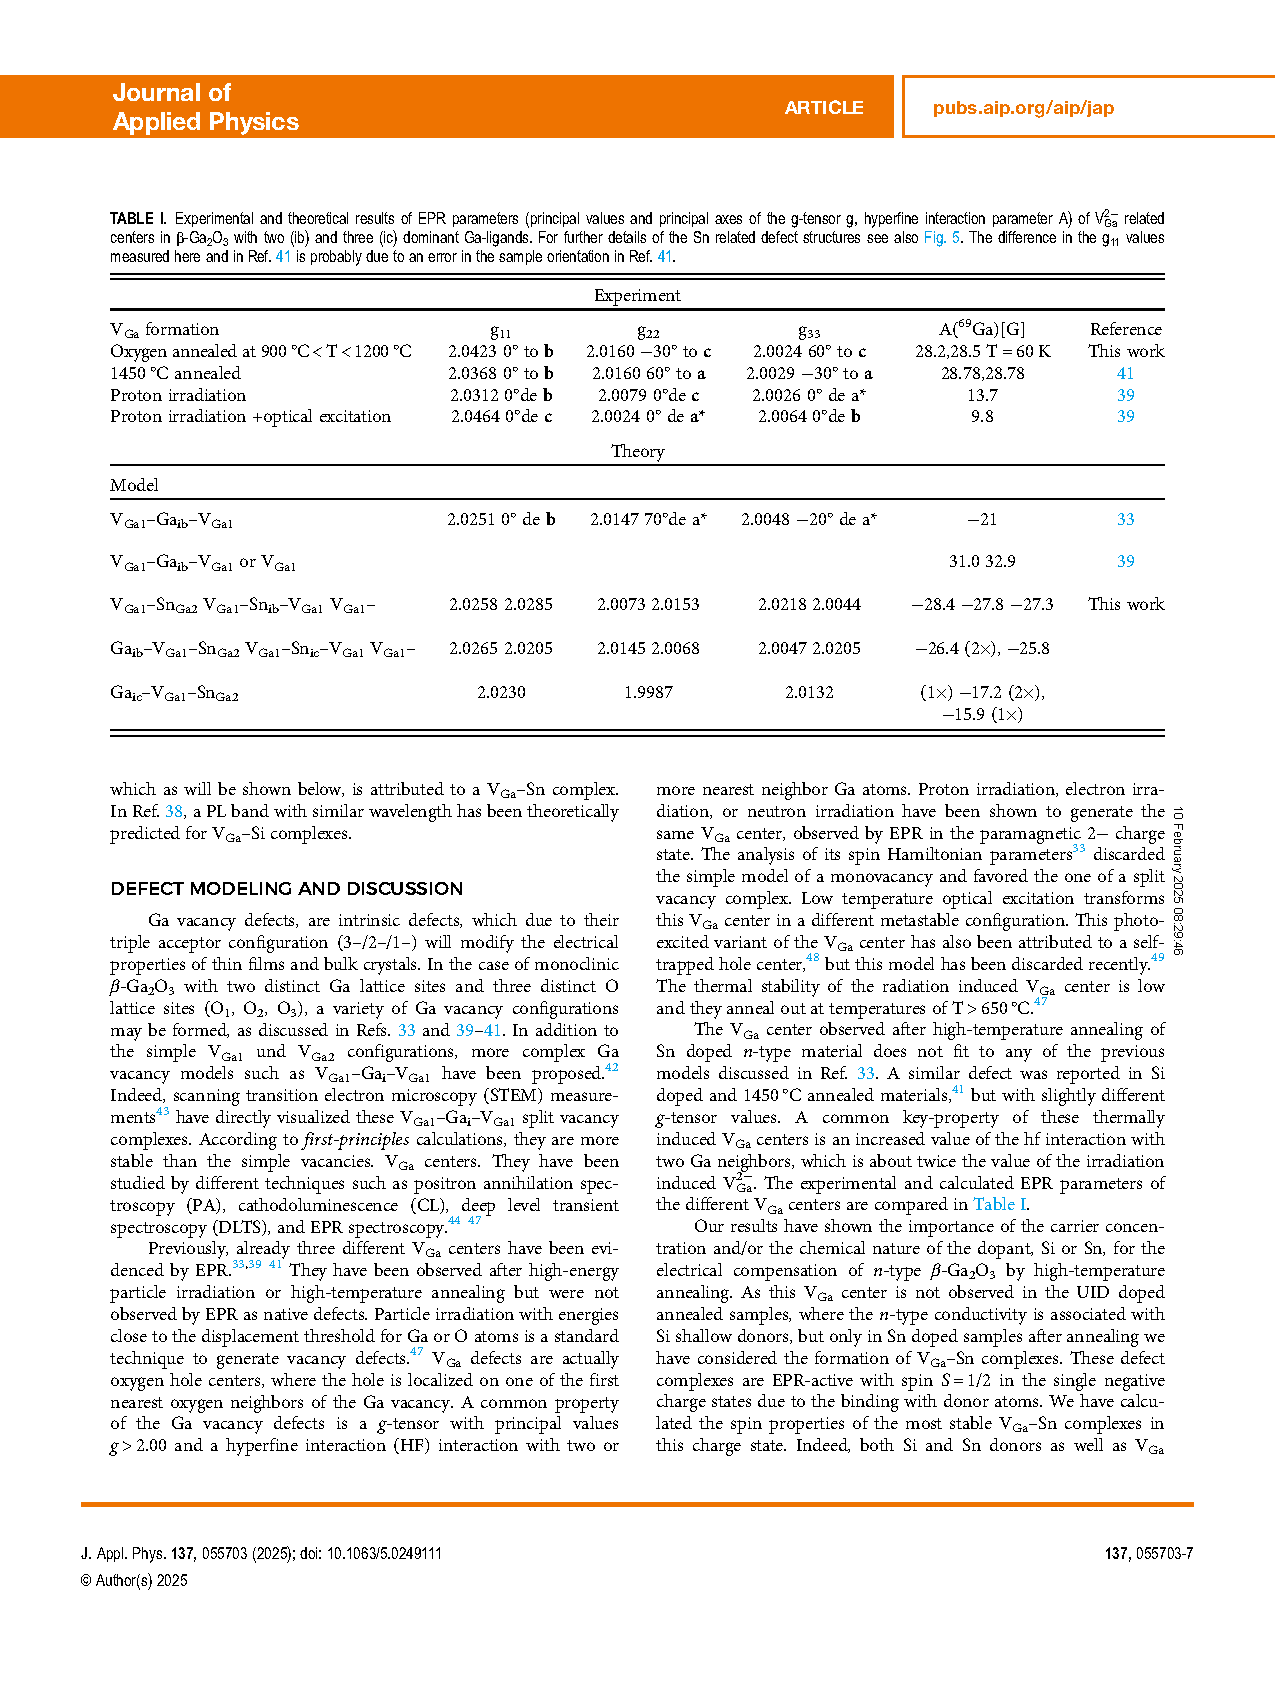
By electron paramagnetic resonance (EPR) and photoluminescence spectroscopy, we have investigated the effect of high-temperature annealing under oxygen atmosphere on the electrical and defect properties of unintentionally doped (UID) and highly doped (Sn) n-type bulk samples of β-Ga2O3. The EPR analysis of the shallow donor concentration shows efficient electrical compensation in the Sn doped β-Ga2O3 samples but only marginal changes for the UID samples. In the Sn doped samples, we observe the formation of a Ga vacancy related acceptor defect responsible for the compensation. Its spin Hamiltonian parameters are electron spin S = 1/2, g-tensor g11 = 2.0423, g22 = 2.0160, g33 = 2.0024, and hyperfine interaction (hf) with two equivalent Ga atoms with A(69Ga) = 28 G. To identify its microscopic structure, we have performed first-principles calculations of the EPR parameters and the associated photoluminescence spectra of different Ga vacancy–Sn donor complexes, including a simple nearest neighbor pair VGa–SnGa. From these calculations, we attribute this VGa defect to a negatively charged split vacancy complex VGa1–Snib–VGa1. This VGa defect is different from the irradiation induced VGa center.
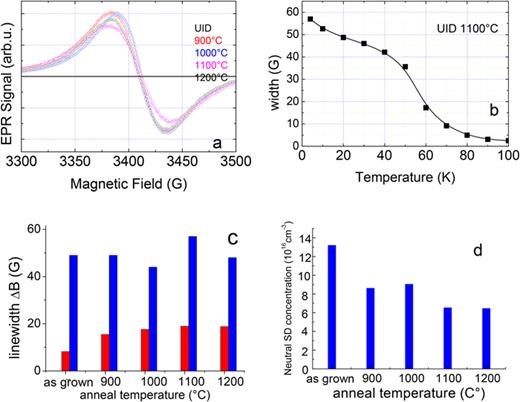
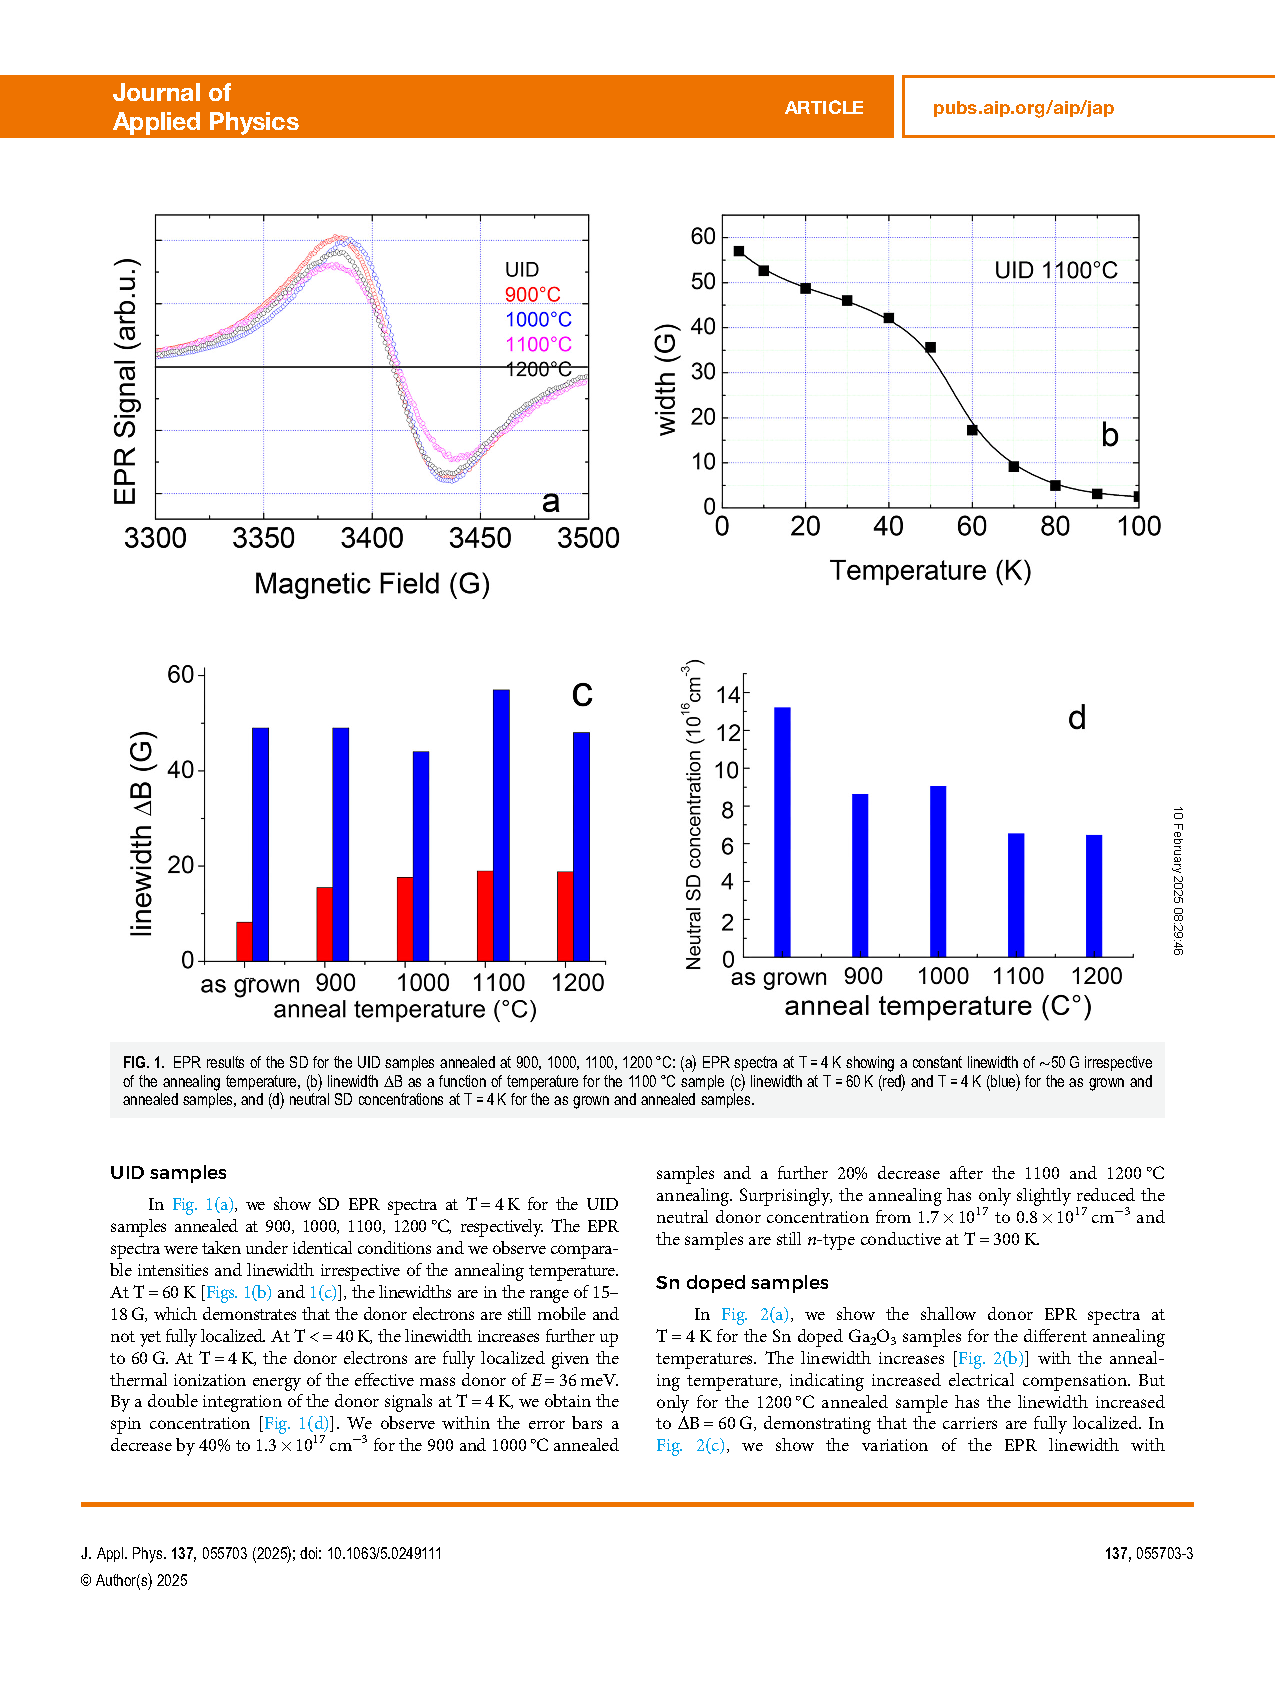
FIG. 1. EPR results of the SD for the UID samples annealed at 900, 1000, 1100, 1200 °C: (a) EPR spectra at T = 4 K showing a constant linewidth of ∼50 G irrespective of the annealing temperature, (b) linewidth ΔB as a function of temperature for the 1100 °C sample (c) linewidth at T = 60 K (red) and T = 4 K (blue) for the as grown and annealed samples, and (d) neutral SD concentrations at T = 4 K for the as grown and annealed samples.
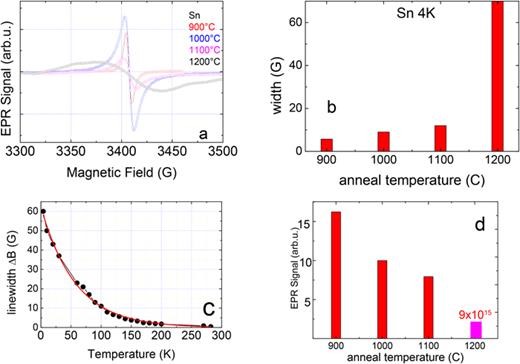
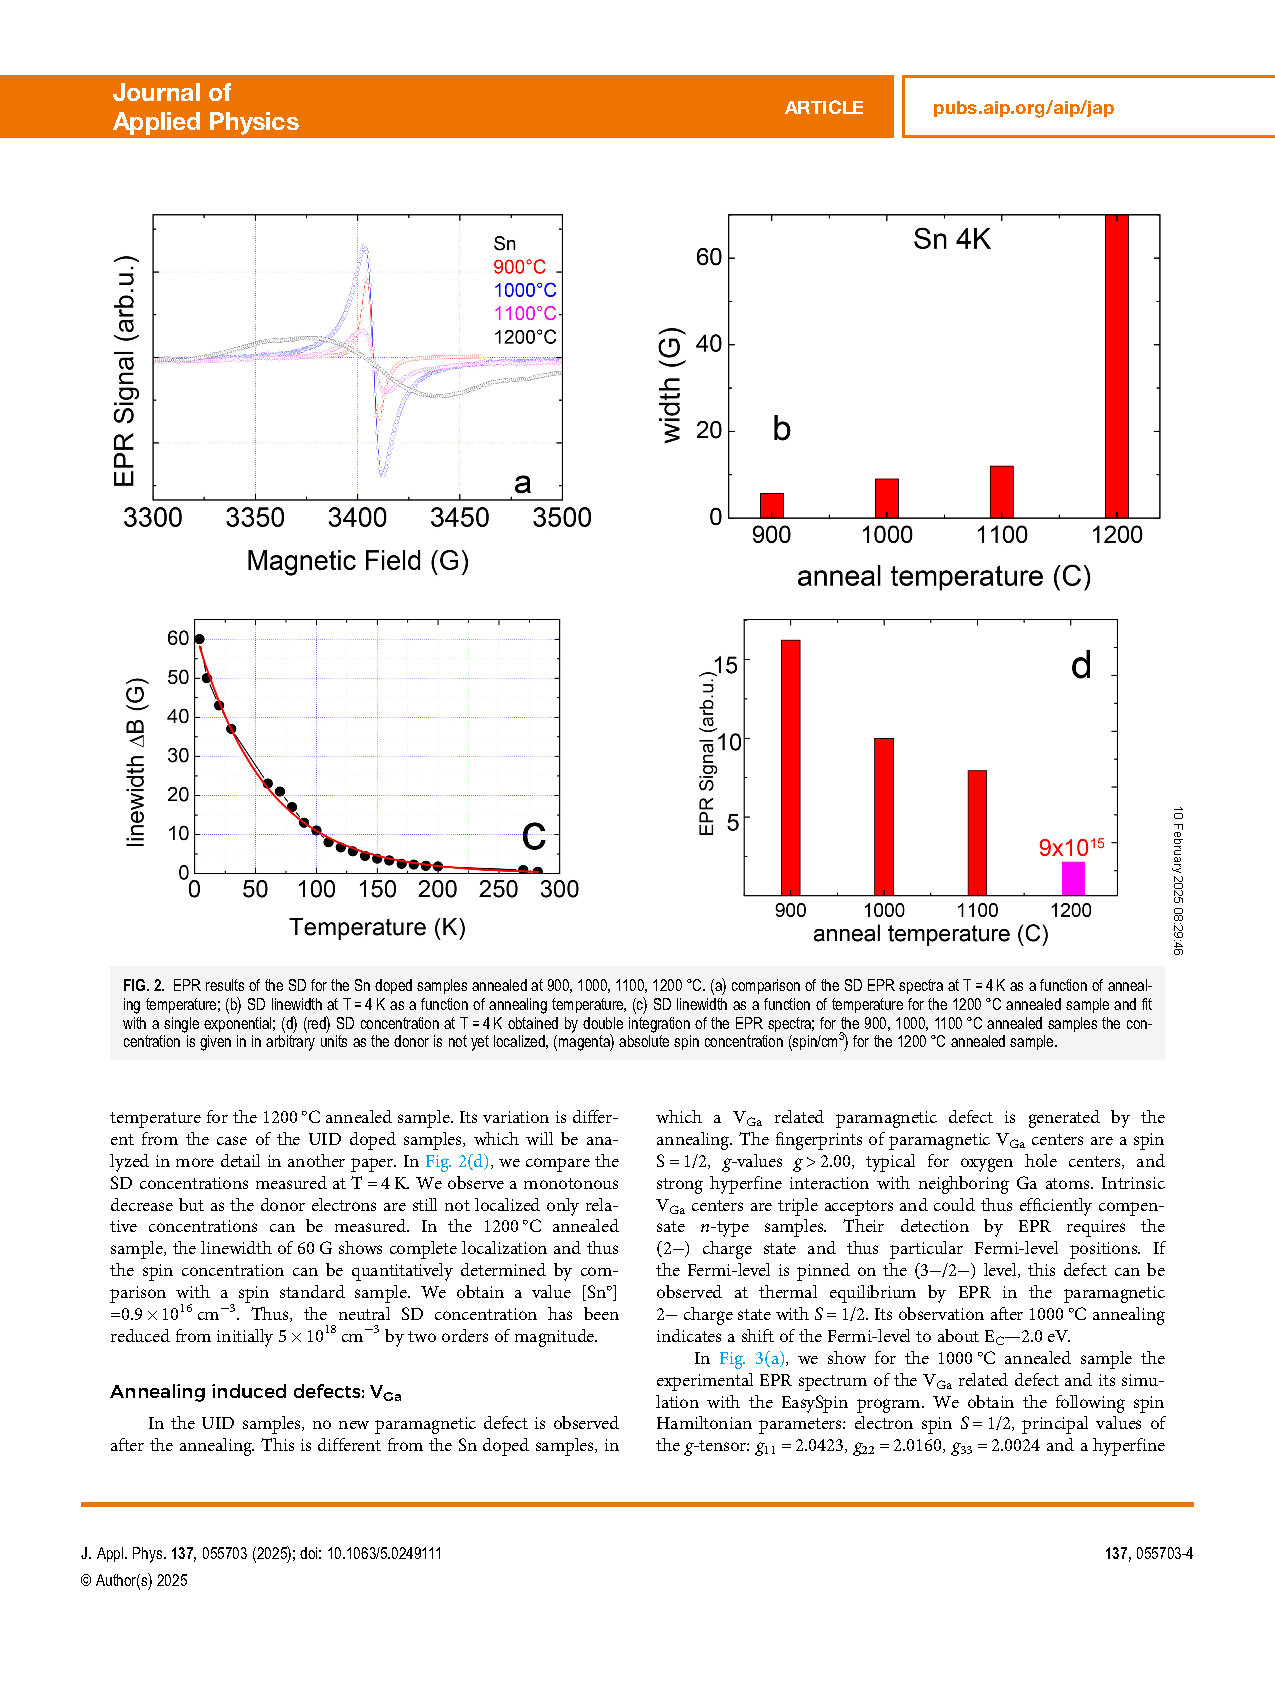
FIG. 2. EPR results of the SD for the Sn doped samples annealed at 900, 1000, 1100, 1200 °C. (a) comparison of the SD EPR spectra at T = 4 K as a function of annealing temperature; (b) SD linewidth at T = 4 K as a function of annealing temperature, (c) SD linewidth as a function of temperature for the 1200 °C annealed sample and fit with a single exponential; (d) (red) SD concentration at T = 4 K obtained by double integration of the EPR spectra; for the 900, 1000, 1100 °C annealed samples the concentration is given in arbitrary units as the donor is not yet localized, (magenta) absolute spin concentration (spin/cm3) for the 1200 °C annealed sample.
DOI:
doi.org/10.1063/5.0249111