Paper Sharing
【Member Papers】DFT mechanistic insights into the atomic layer deposition of β-Ga₂O₃
日期:2025-10-31阅读:1512
Researchers from the Harbin Institute of Technology have published a dissertation titled "DFT mechanistic insights into the atomic layer deposition of β-Ga2O3" in RSC Advances.
Project Support
This work is supported by the National Science Foundation of China under Grant No. 12172112, 52293372, 11932005, and 11974091 and the National Natural Science Foundation of China (Joint Fund for Corporate Innovation and Development – Key Program) Grant no. U22B2082.
Background
Gallium oxide (Ga2O3) holds an important strategic position in the prospective layout of semiconductor technology due to its excellent physical properties, and thus, numerous studies have been conducted on its various crystal forms, such as α-Ga2O3, β-Ga2O3, γ-Ga2O3, δ-Ga2O3 and ε-Ga2O3, and their applications.
Among the different phases of Ga2O3, β-Ga2O3 is the most stable crystal structure11 and the only natural substrate that can be grown into large single crystals via melt growth. β-Ga2O3 exhibits superior electrical properties and thermal stability, with a melting point reaching up to 1900 °C. In contrast, the thermal stability of other polymorphs of Ga2O3 are poor, and they convert to the stable β-form upon heat treatment. Furthermore, β-Ga2O3 is an ultra-wide bandgap transparent semiconductor oxide with an energy gap of 4.85 eV. Thus, β-Ga2O3 is the most widely used phase of gallium oxide in the semiconductor field, including the manufacturing of electronic high-power devices such as power field-effect transistors (FETs) and photodiodes, production of solar-blind UV photodetectors, gas sensors, and other devices. Moreover, it can be used as a catalyst; for instance, β-Ga2O3(001) can be used in the adsorption of reactants and intermediates involved in the hydrogenation of CO2 and Ag-loaded β-Ga2O3 photocatalysts can be used in the photocatalytic carbon dioxide reduction.
Conclusion
In this study, we investigated the growth process of β-Ga2O3 using Ga(CH3)3 and O2 as Ga and O sources using DFT, respectively, revealing the reaction mechanism involved in the reaction process. We employed the climbing image nudged elastic band method to interpolate between the initial and final states of the reaction, thereby optimizing the entire reaction pathway and calculating the energy barrier of individual reaction processes using this method.
During the first reaction of Ga(CH3)3 depositing onto the hydrogen-terminated β-Ga2O3 surface, two of the three methyl groups move away from the Ga atom and attract surface H atoms to form CH4 gas. Therefore, the Ga atoms are captured by O atoms in the form of methyl gallium. When Ga(CH3)3 is subsequently deposited onto the surface of gallium oxide after H atoms have been consumed, one methyl group is decomposed onto the surface-O. Also, one of the other two methyl groups is attracted by this methyl group, thus moving away from the Ga atom and bonding with it. The H atoms on the two bonded methyl groups are attracted by the surface O atoms, generating C2H4 gas and leaving the system. After the deposition process, which a layer of Ga atoms is added on the surface of the model in the form of the product methyl gallium, we subsequently employed inert gas blowing to meticulously remove any residual precursors or by-products that may have adhered to the surface. Then, O2 only reacts with methyl groups during the oxidation process, and the H atoms in the methyl groups and O atoms form hydroxyl groups, which are captured by the Ga atom. The carbon atoms in the two methyl groups attract each other, forming a C–C bond and producing C2H4 gas, which leaves the system. This oxidation process results in the formation of an O atomic layer on the surface of the model. Consequently, the β-Ga2O3 thin film can be produced by repeating the deposition and oxidation process.
The calculation results in this work not only provide some insights into the growth of a β-Ga2O3 layer on the surface of hydrogen-terminated β-Ga2O3 (100), providing the corresponding parameters for multi-scale simulation in subsequent work, and simulate and analyze at higher time and spatial scales, but also provide impetus for further theoretical and experimental research.
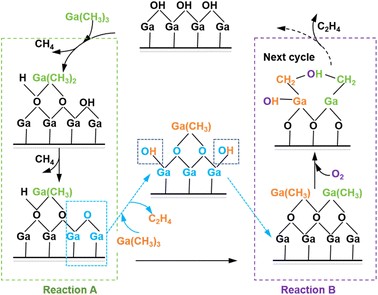
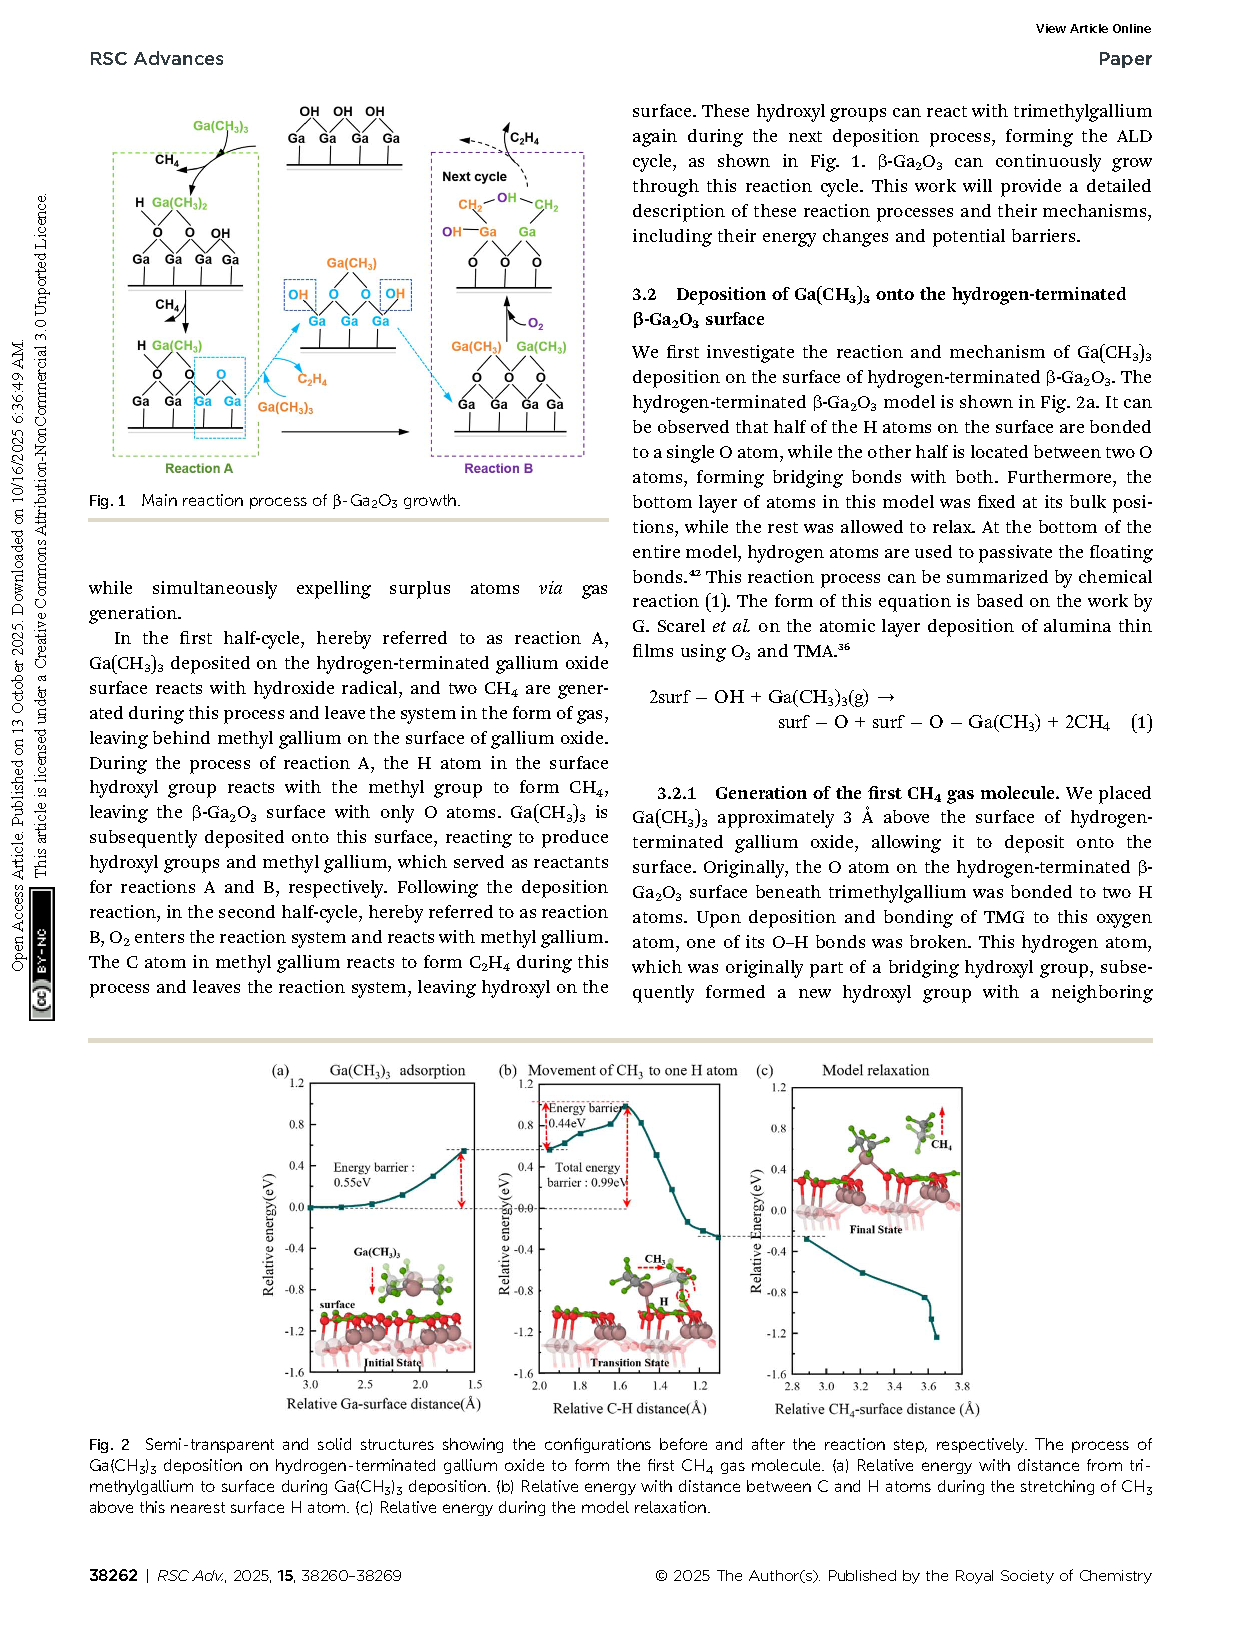
Fig. 1 Main reaction process of β-Ga2O3 growth.
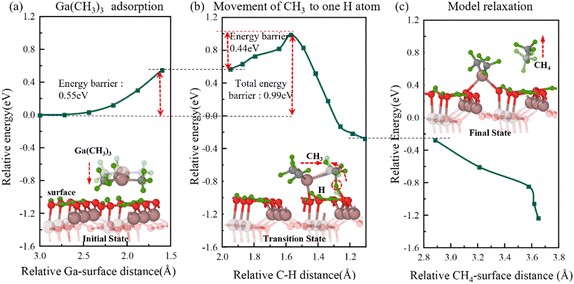
Fig. 2 Semi-transparent and solid structures showing the configurations before and after the reaction step, respectively. The process of Ga(CH3)3 deposition on hydrogen-terminated gallium oxide to form the first CH4 gas molecule. (a) Relative energy with distance from trimethylgallium to surface during Ga(CH3)3 deposition. (b) Relative energy with distance between C and H atoms during the stretching of CH3 above this nearest surface H atom. (c) Relative energy during the model relaxation.
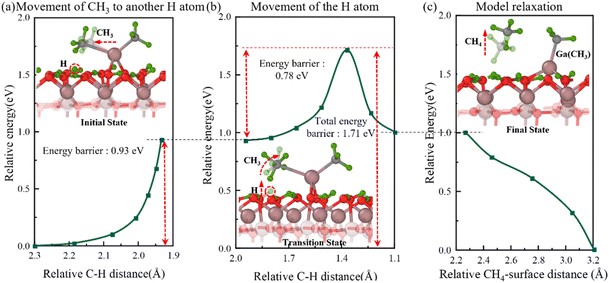
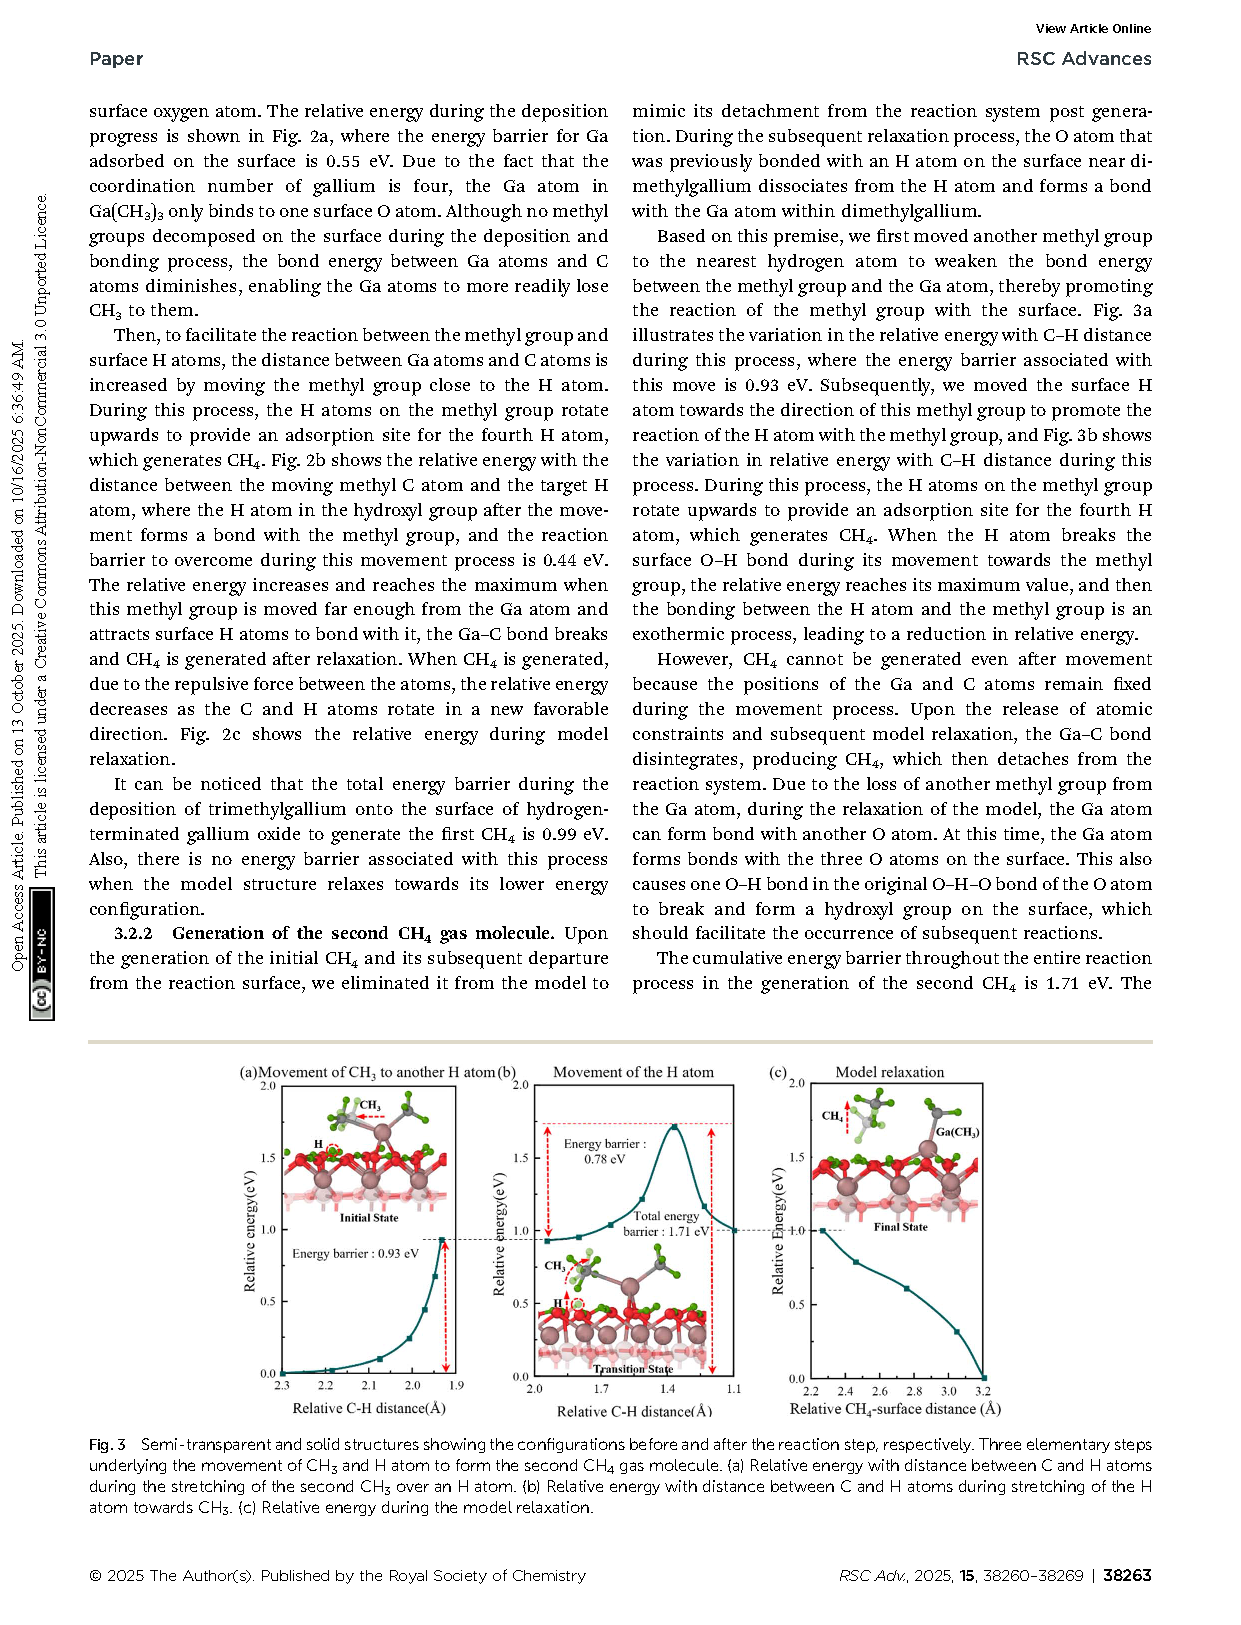
Fig. 3 Semi-transparent and solid structures showing the configurations before and after the reaction step, respectively. Three elementary steps underlying the movement of CH3 and H atom to form the second CH4 gas molecule. (a) Relative energy with distance between C and H atoms during the stretching of the second CH3 over an H atom. (b) Relative energy with distance between C and H atoms during stretching of the H atom towards CH3. (c) Relative energy during the model relaxation.
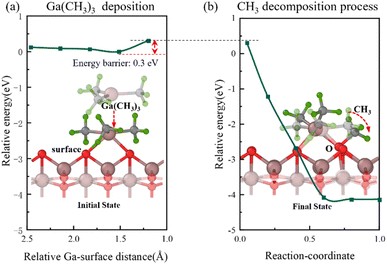
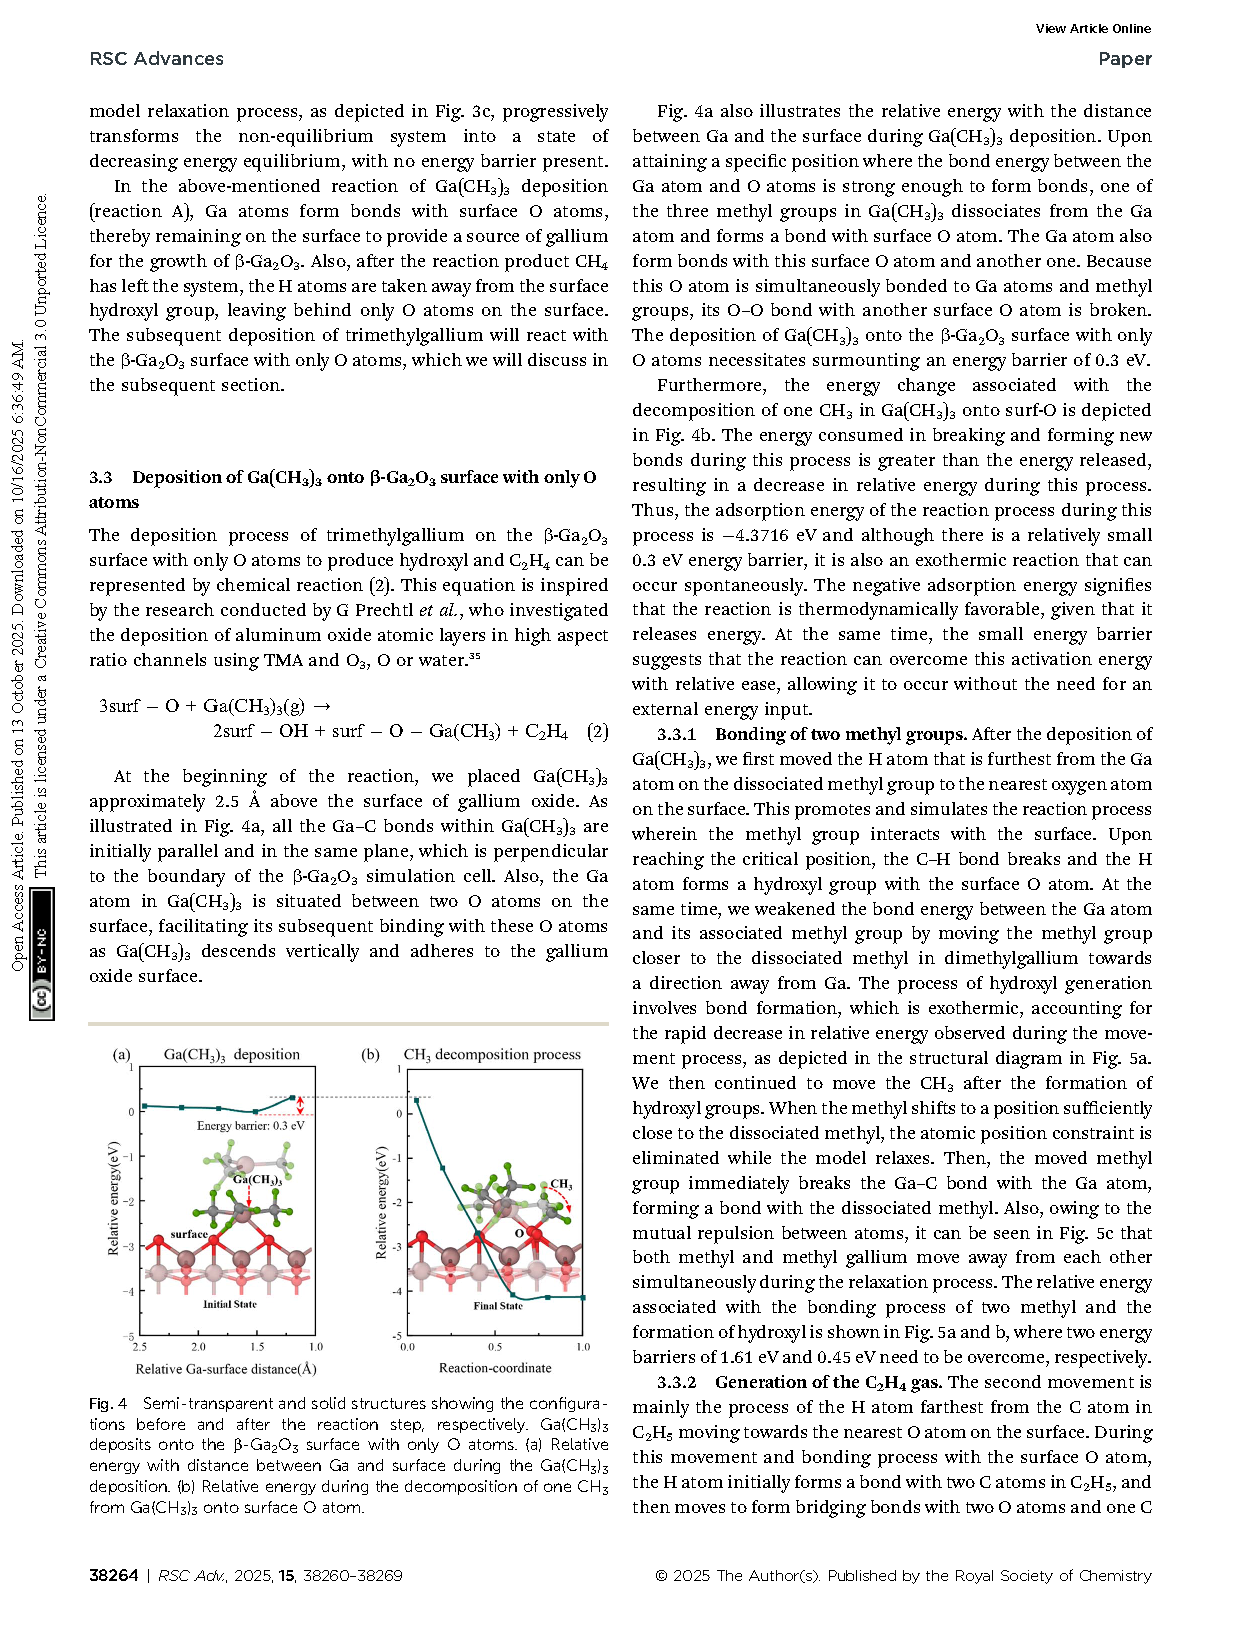
Fig. 4 Semi-transparent and solid structures showing the configurations before and after the reaction step, respectively. Ga(CH3)3 deposits onto the β-Ga2O3 surface with only O atoms. (a) Relative energy with distance between Ga and surface during the Ga(CH3)3 deposition. (b) Relative energy during the decomposition of one CH3 from Ga(CH3)3 onto surface O atom.
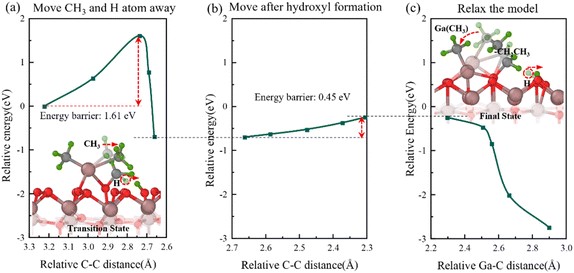
Fig. 5 Semi-transparent and solid structures showing the configurations before and after the reaction step, respectively. Bonding of two methyl groups. (a) Relative energy with distance between C atoms in two shifted methyl groups during the movement of CH3 and H atoms. (b) Relative energy variation in the process of continuous movement after forming surf − OH. (c) Relative energy during the model relaxation.
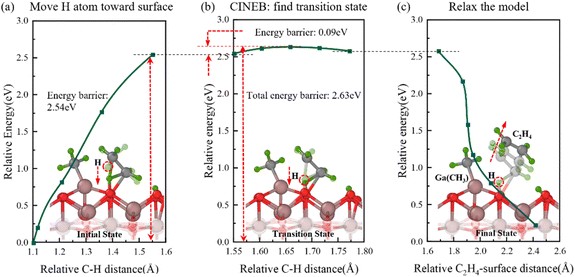
Fig. 6 Semi-transparent and solid structures showing the configurations before and after the reaction step, respectively. The generation of C2H4 gas. (a) Relative energy with distance between the moved methyl H atom and its C atom during the movement of H atom toward surface O atom. (b) Relative energy variation in the CINEB process to find the transition state. (c) Relative energy during the model relaxation.
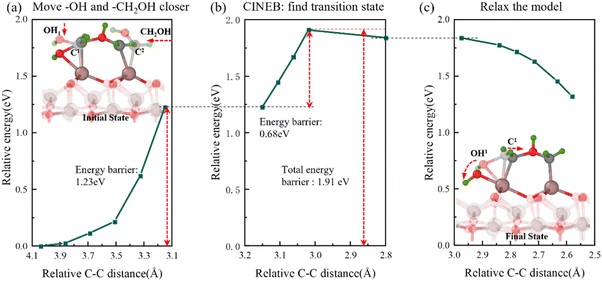
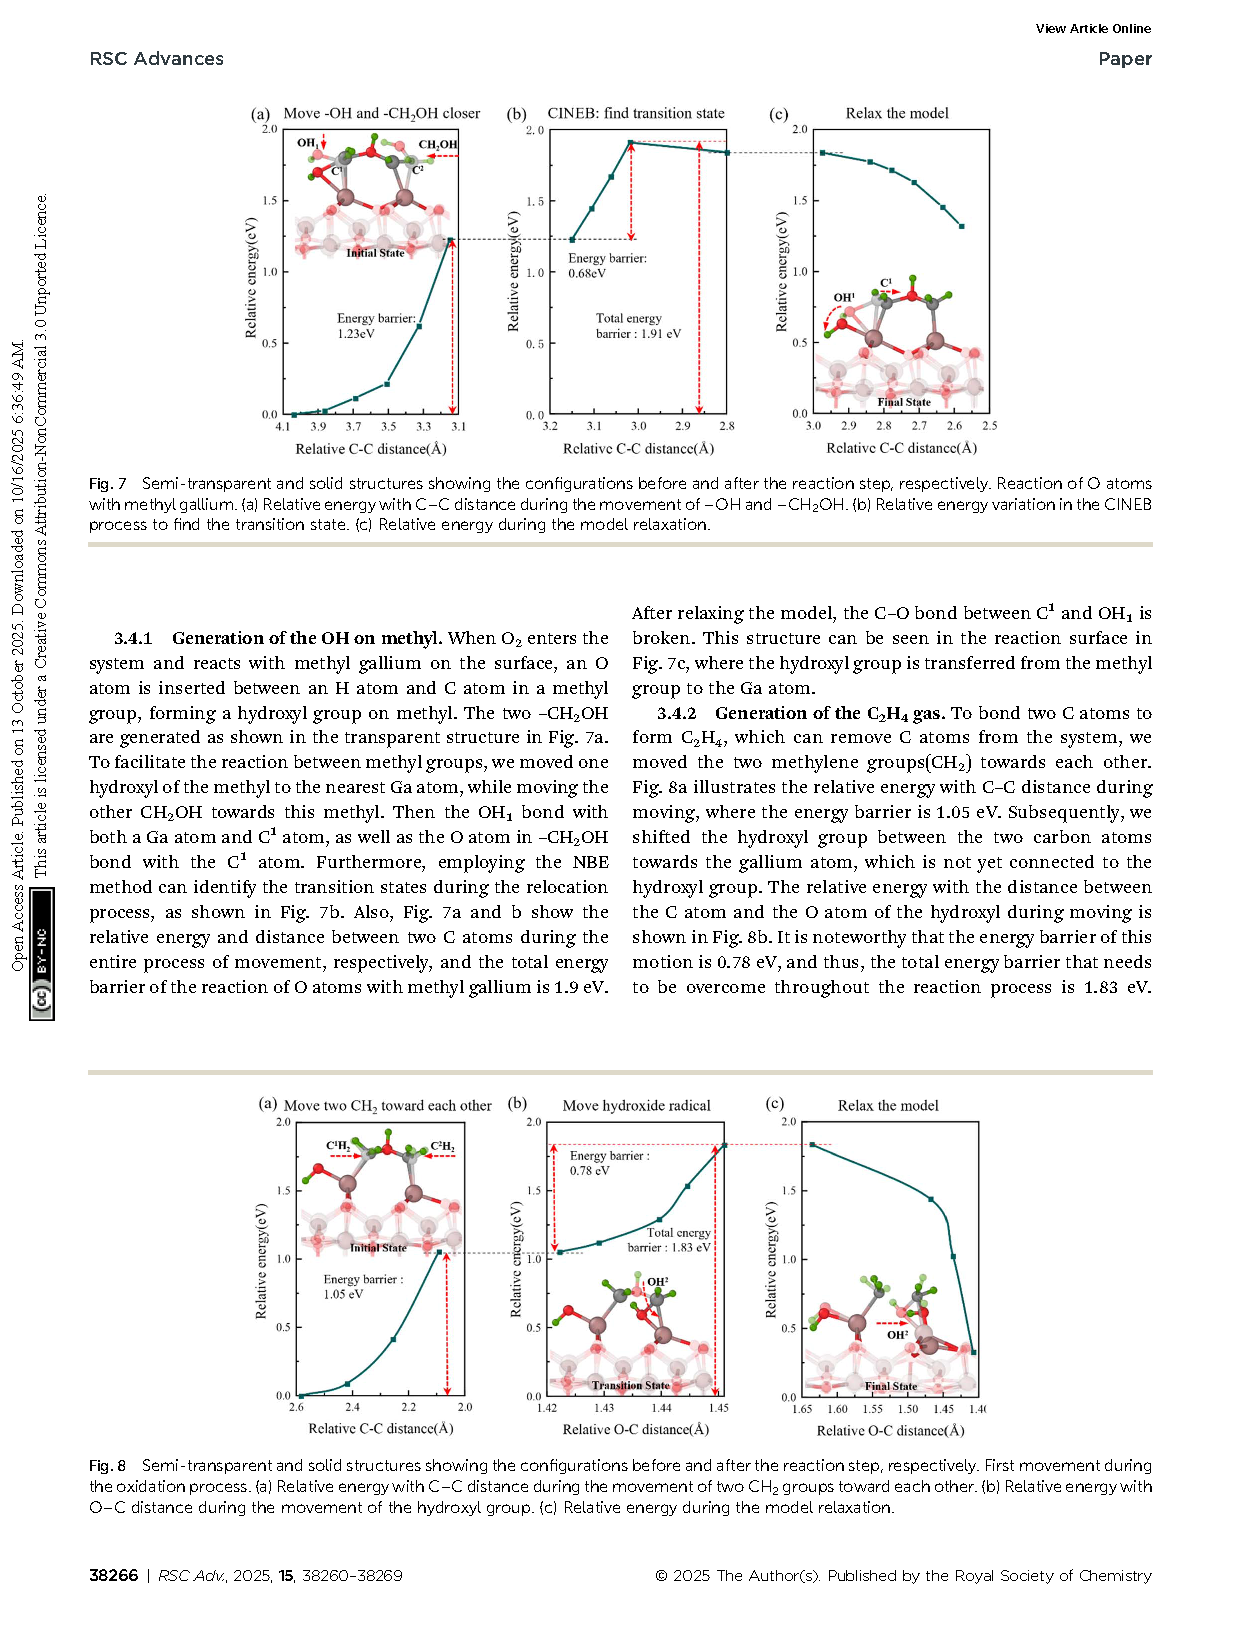
Fig. 7 Semi-transparent and solid structures showing the configurations before and after the reaction step, respectively. Reaction of O atoms with methyl gallium. (a) Relative energy with C–C distance during the movement of –OH and –CH2OH. (b) Relative energy variation in the CINEB process to find the transition state. (c) Relative energy during the model relaxation.
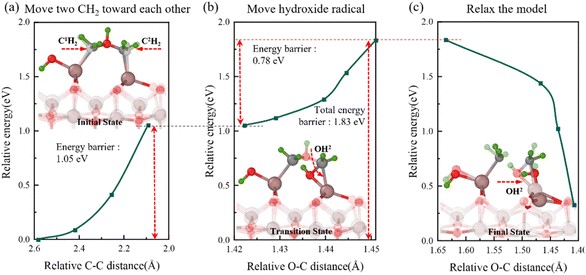
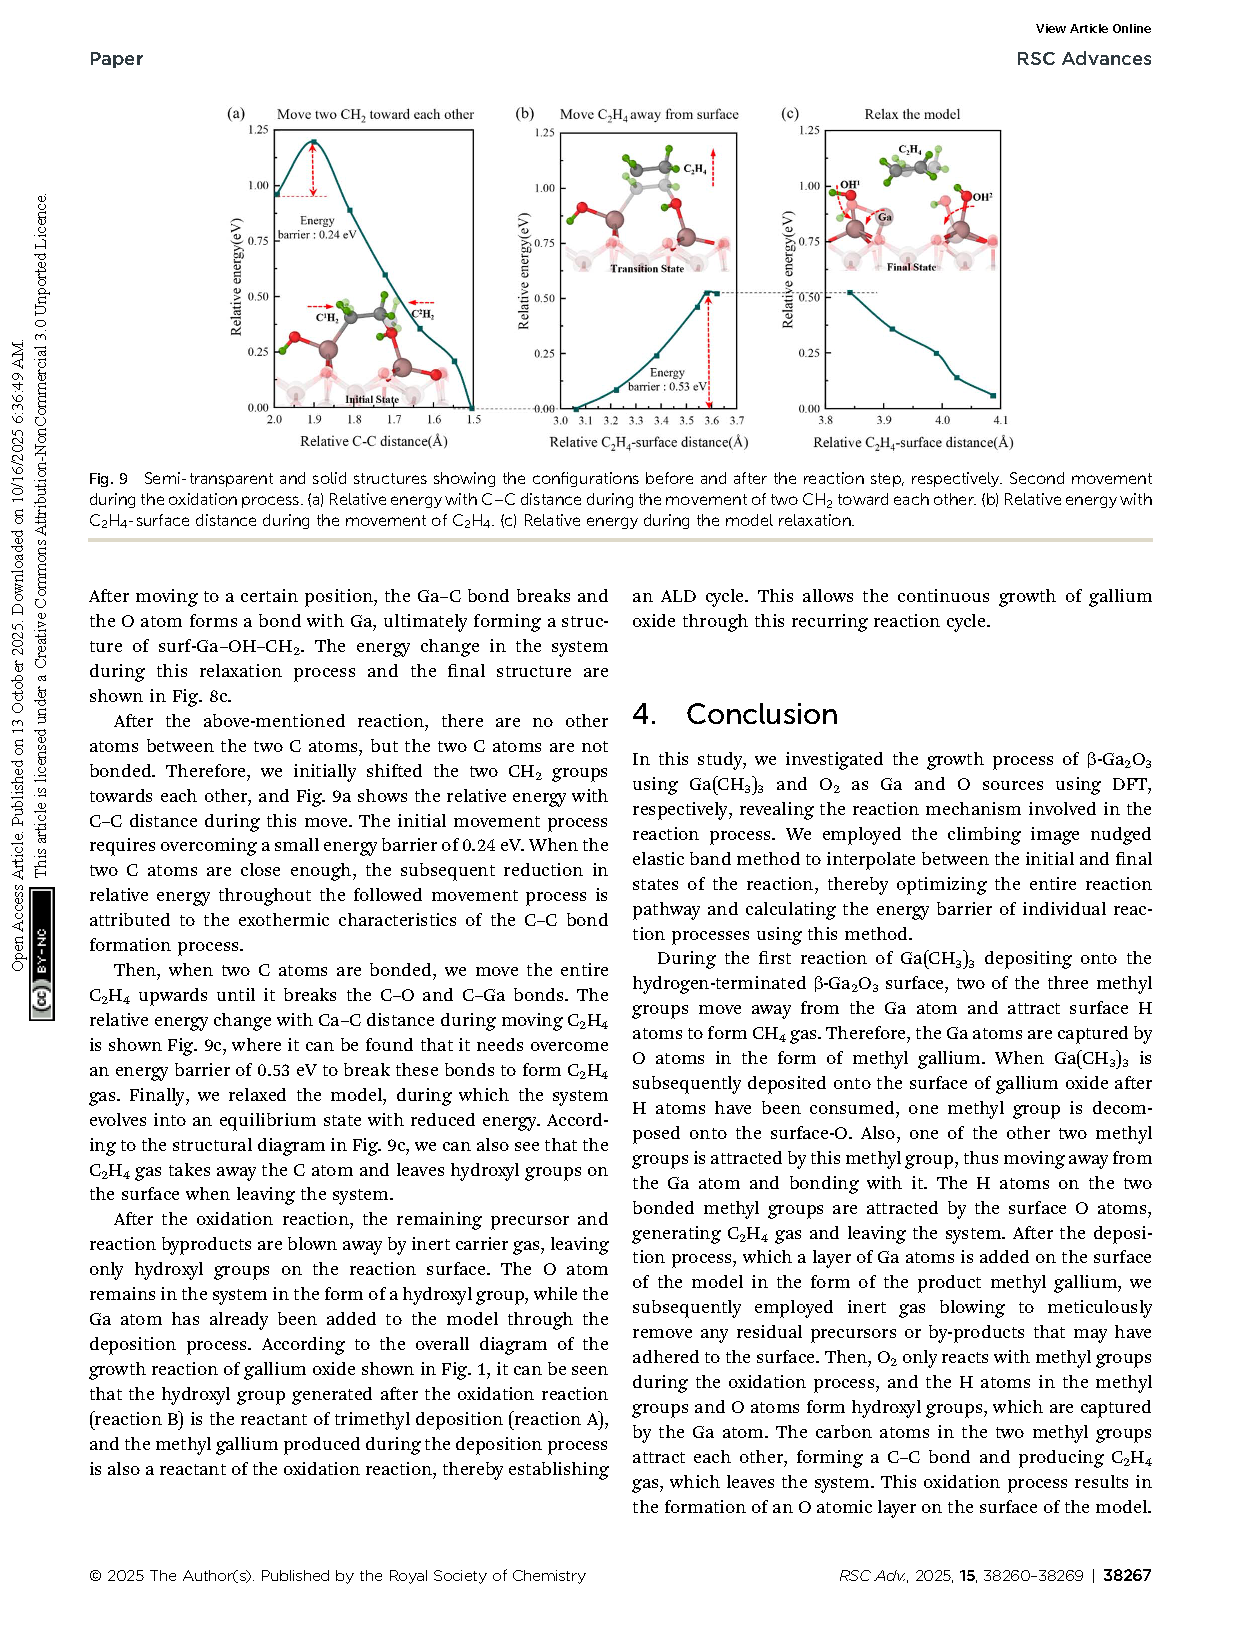
Fig. 8 Semi-transparent and solid structures showing the configurations before and after the reaction step, respectively. First movement during the oxidation process. (a) Relative energy with C–C distance during the movement of two CH2 groups toward each other. (b) Relative energy with O–C distance during the movement of the hydroxyl group. (c) Relative energy during the model relaxation.
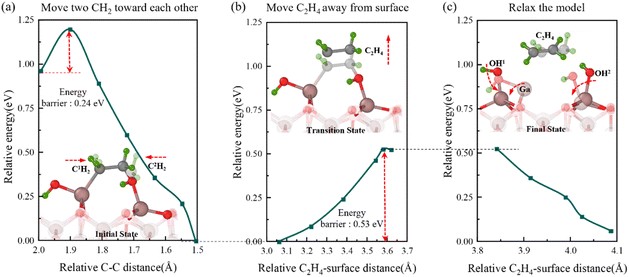
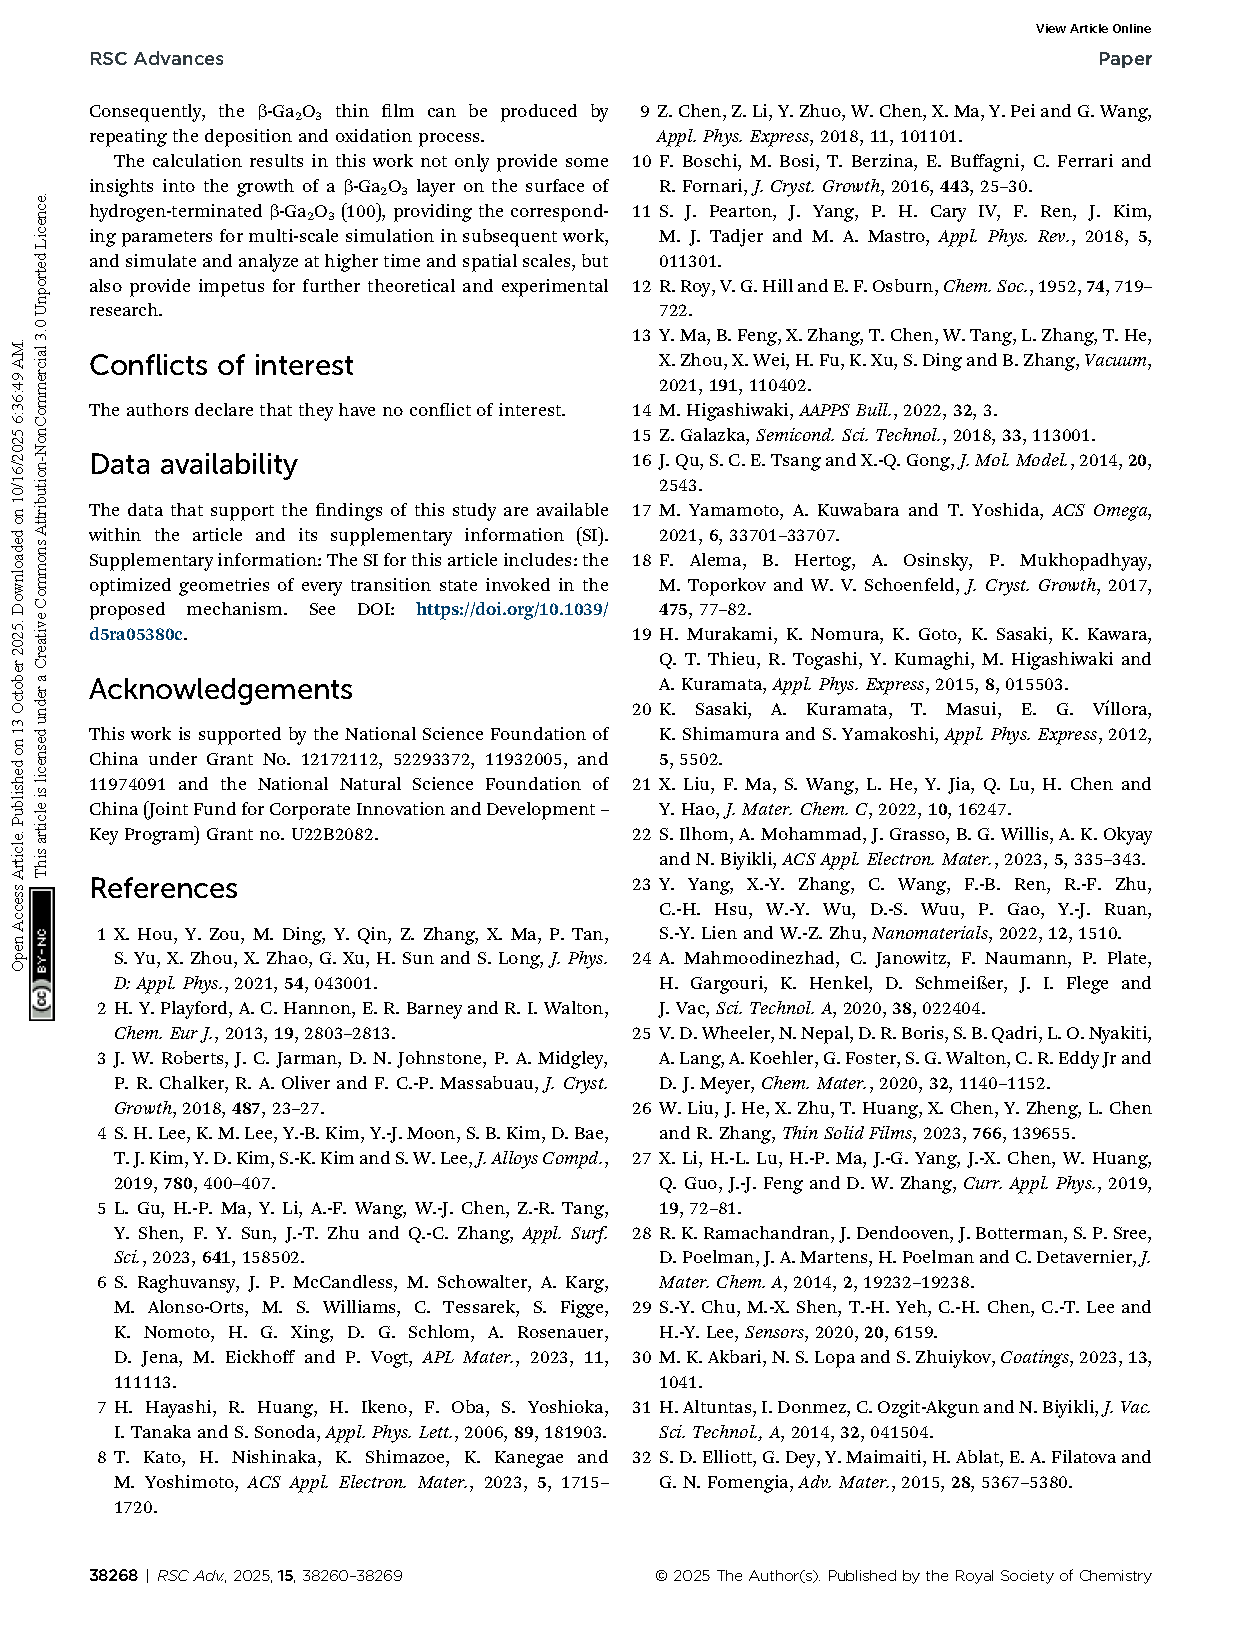
Fig. 9 Semi-transparent and solid structures showing the configurations before and after the reaction step, respectively. Second movement during the oxidation process. (a) Relative energy with C–C distance during the movement of two CH2 toward each other. (b) Relative energy with C2H4-surface distance during the movement of C2H4. (c) Relative energy during the model relaxation.
DOI:
doi.org/10.1039/D5RA05380C