


Researchers from the Istanbul University have published a dissertation titled " Coupled effects of crystallographic orientation and Sn-doping on the structural, optical, and Raman anisotropy of β-Ga₂O₃ single crystals " in Journal of Alloys and Compounds.
Background
Monoclinic β-Ga₂O₃ is a thermodynamically stable ultra-wide bandgap semiconductor with a bandgap of 4.8–4.9 eV. It possesses ultrahigh breakdown electric field and outstanding thermal stability. Large-area single-crystal wafers can be fabricated via edge-defined film-fed growth (EFG) and Czochralski methods, which makes it promising for deep-ultraviolet photodetectors, high-temperature power electronics and optoelectronic devices operating under harsh environments. As a low-symmetry monoclinic crystal, β-Ga₂O₃ exhibits intrinsic anisotropy in structural, optical and vibrational properties. Crystallographic orientation directly modulates band structure, birefringence, phonon scattering and crystal quality, acting as a decisive parameter for material characterization and device fabrication.
Tin (Sn) is a widely adopted shallow donor dopant for β-Ga₂O₃, which can continuously tune free carrier concentration and fabricate conductive n-type bulk substrates. Sn incorporation induces Burstein–Moss band-filling blue shifts, impurity band formation and band-tail distortion in optical absorption, and modifies local bonding configurations and defect distributions to alter Raman phonon responses.
Most previous works separately investigated either the intrinsic anisotropy of β-Ga₂O₃ or the independent influence of Sn doping. Systematic comparative experiments covering two mainstream wafer orientations (001) and (201) with a series of Sn carrier concentrations are still absent. The coupled effects of crystallographic orientation and Sn dopants on crystal lattice evolution, absorption edge shift and polarized Raman anisotropy remain insufficiently clarified. Moreover, the orientation dependence of the broad doping-related Raman feature around 250–257 cm⁻¹ lacks comprehensive experimental verification, which restricts rational substrate selection and anisotropy-aware device design. To fill this research gap, this work performs comparative characterizations including angle-resolved XRD, optical transmission spectroscopy and angle-resolved polarized Raman on unintentionally doped and gradient Sn-doped EFG-grown β-Ga₂O₃ single crystals with (001) and (201) orientations, to reveal the coupled interactions between crystal orientation and Sn donor incorporation.
Abstract
This study investigates how crystallographic orientation and Sn donor incorporation jointly affect the structural, optical, and Raman anisotropy of EFG-grown β-Ga₂O₃ single crystals. Unintentionally doped and Sn-doped wafers with (001) and (201) orientations were compared using angle-resolved X-ray diffraction, optical absorption spectroscopy, and polarized Raman scattering. XRD confirms phase-pure monoclinic β-Ga₂O₃ for all samples, while the (001)-oriented wafers exhibit narrower diffraction features than the (201)-oriented wafers. Optical absorption analysis reveals a Sn-induced blue shift of the effective absorption edge, consistent with donor-related band filling via the Burstein–Moss effect, together with orientation-dependent changes in the near-edge absorption tail. Polarized Raman measurements show that the angular phonon response is strongly mode- and orientation-dependent. The (001) orientation preserves more stable Raman anisotropy fingerprints with increasing Sn concentration, whereas the (201) orientation exhibits stronger doping-induced redistribution of the anisotropic Raman response. In addition, a broad Raman feature near 257 cm⁻¹ is resolved only in the Sn-doped (201)-oriented samples, indicating orientation-dependent sensitivity to donor- and carrier-concentration-related Raman responses. These results demonstrate that Sn-doped β-Ga₂O₃ must be evaluated within an orientation-dependent framework for reliable substrate selection and anisotropy-aware device design.
Highlights
For the first time, a unified EFG single-crystal platform is adopted to systematically compare two industrially mainstream β-Ga₂O₃substrates (001) and (201), quantitatively revealing the coupled effects of crystallographic orientation and Sn donor doping on structural, optical and Raman anisotropy, overcoming the drawbacks of single-orientation research.
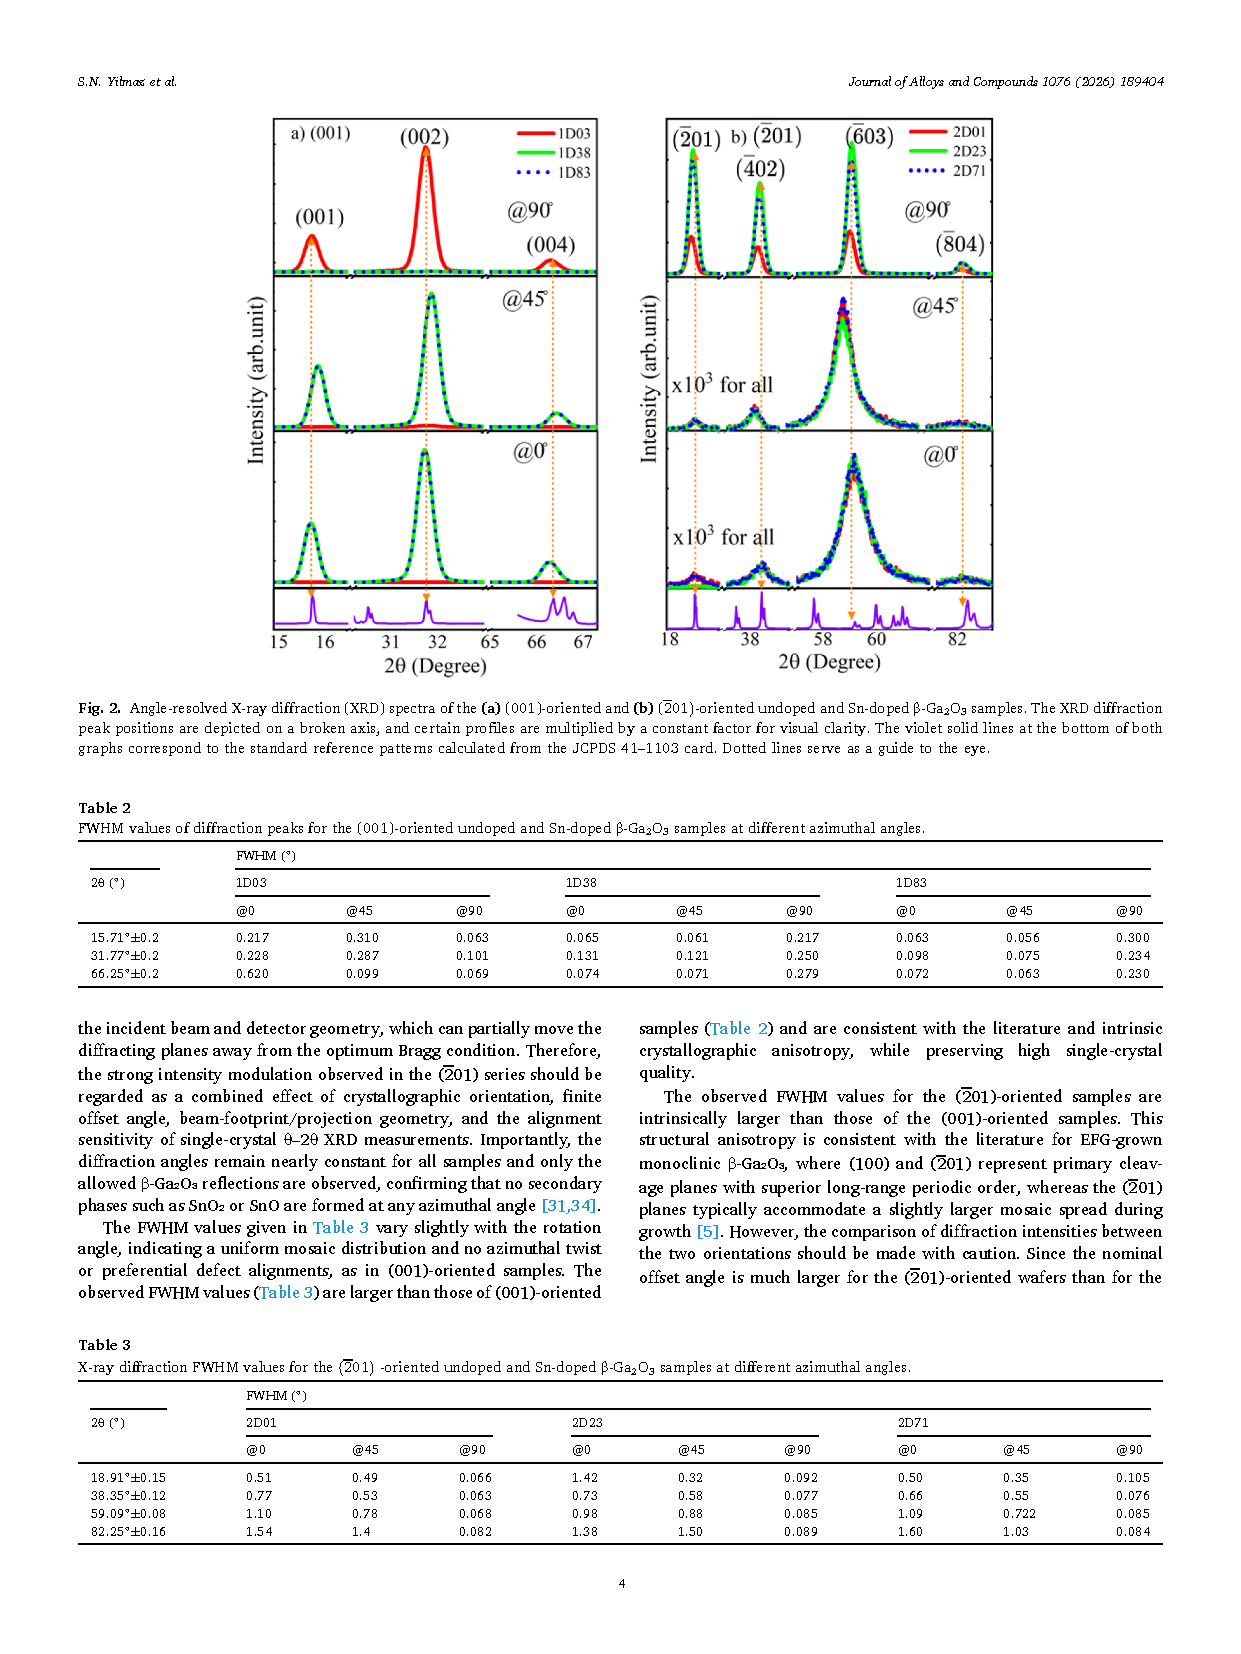
Angle-resolved XRD quantitatively verifies that (001) wafers possess superior crystal quality with narrower diffraction FWHM. The (201) substrates show stronger azimuthal diffraction intensity modulation due to larger surface offset angle. It is clarified that peak position stability and FWHM serve as more credible crystal quality indicators than absolute diffraction intensity.
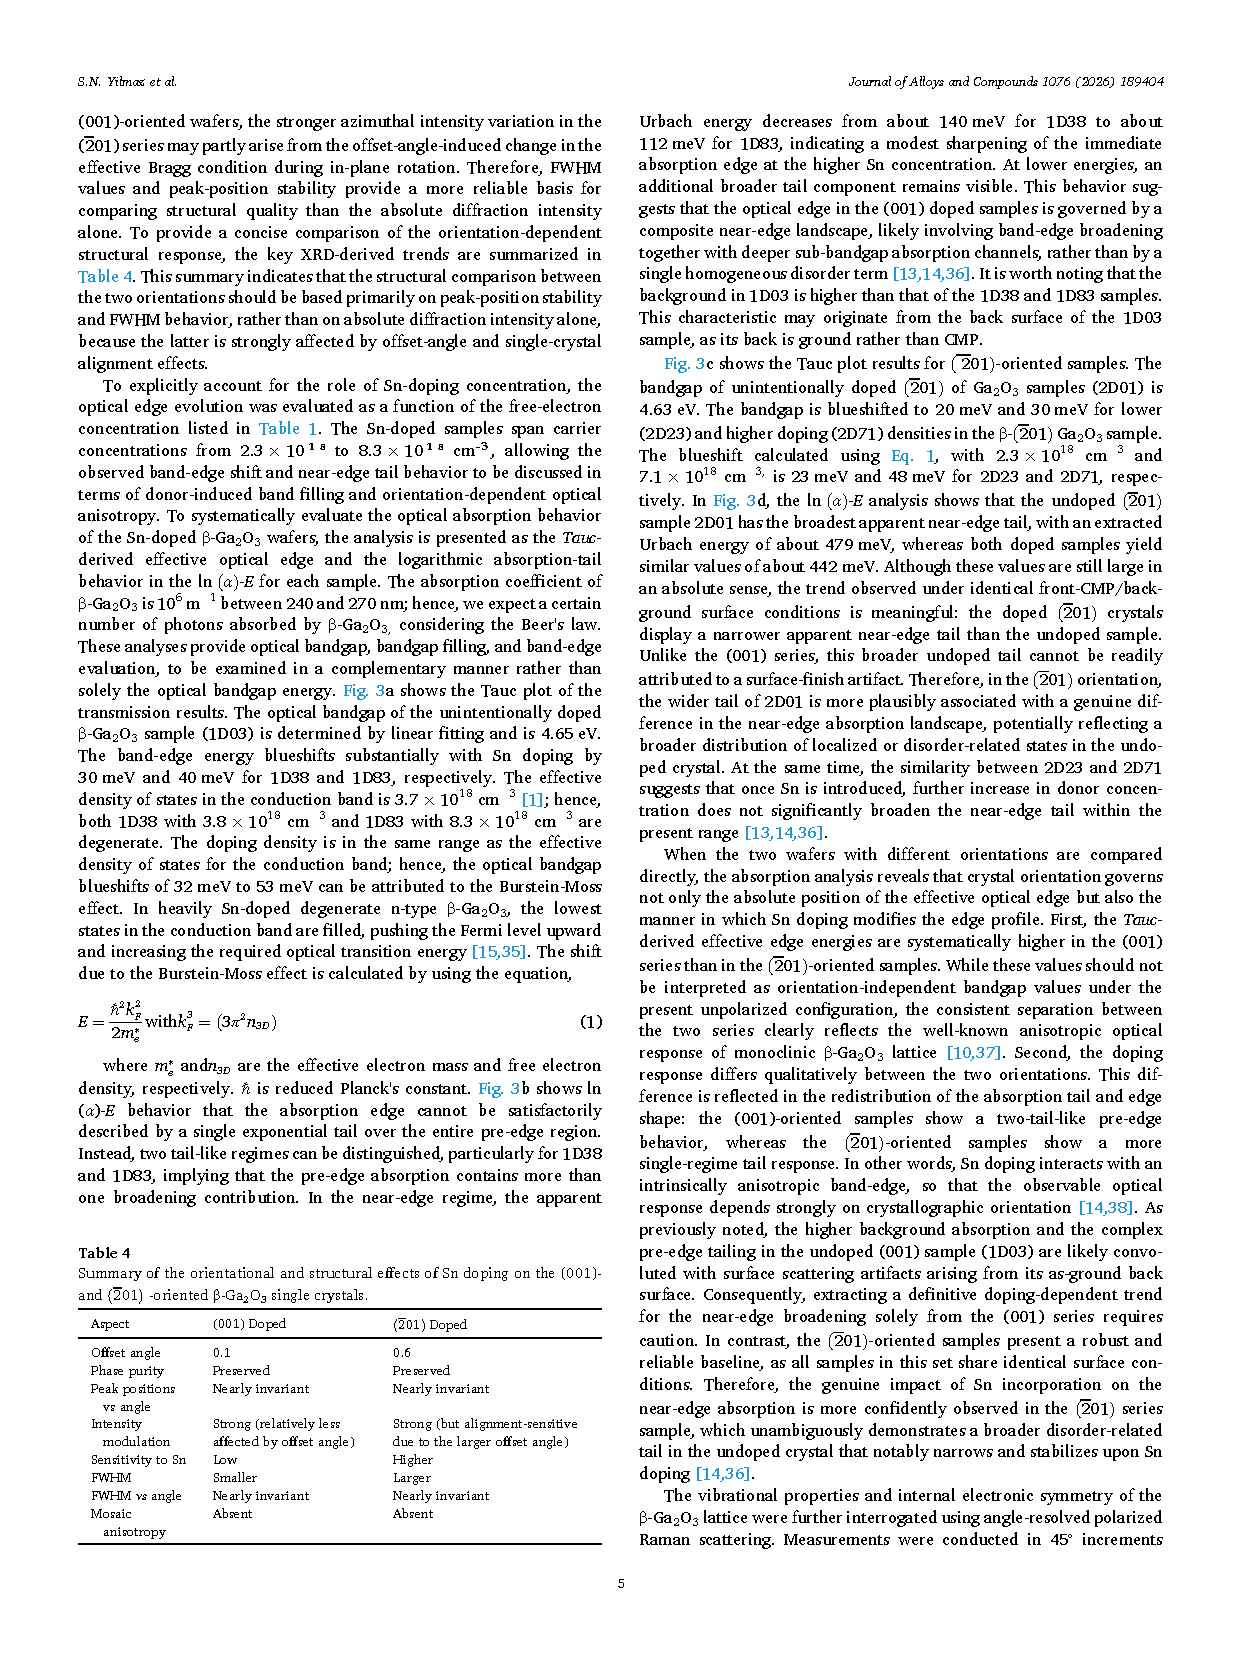
Distinct Burstein–Moss blue shift magnitudes and near-UV absorption tail evolution are distinguished between two orientations: (001) samples exhibit larger bandgap blue shift, while the two substrates display double-tail and single-tail absorption profiles respectively, proving crystal orientation directly modulates how dopants distort band edges.
Polarized Raman results prove that the (001) orientation owns doping-stable anisotropic fingerprints, suitable for standardized Raman characterization. The (201) plane is highly sensitive to Sn-doping-induced lattice perturbation, and the 257 cm⁻¹donor-related broad Raman band can only be detected on this orientation, offering a unique nondestructive characterization window for dopant monitoring.
A phenomenological fitting model based on integrated Raman peak area is established to quantify two-lobed and four-lobed angular distributions of diverse phonon modes. It is illustrated that Sn doping only modulates Raman scattering intensity without altering characteristic angular symmetry, delivering comprehensive experimental guidance for substrate selection of anisotropic optoelectronic devices.
Conclusion
A comprehensive angle-resolved study combining X-ray diffraction, optical absorption spectroscopy, and polarized Raman scattering was performed on UID and Sn-doped β-Ga₂O₃ single-crystal wafers with (001) and (201) surface orientations. The XRD results confirm phase-pure monoclinic β-Ga₂O₃ for all samples and show that Sn incorporation does not produce detectable secondary crystalline phases. The diffraction response is clearly orientation-dependent, with the (001)-oriented wafers exhibiting narrower reflections than the (201)-oriented wafers. The azimuth-dependent diffraction intensity variation is also influenced by the finite wafer offset angle and single-crystal θ–2θ measurement geometry, indicating that peak-position stability and FWHM values provide more reliable structural comparison metrics than absolute diffraction intensity alone. Optical absorption measurements reveal a Sn-concentration-dependent blue shift of the effective absorption edge in both orientation series, consistent with donor-induced band filling and the Burstein–Moss effect in highly conductive n-type β-Ga₂O₃. The near-edge absorption profile also evolves differently for the two wafer orientations, demonstrating that crystallographic orientation affects not only the effective optical edge position but also the way Sn-related carrier concentration modifies the pre-edge absorption tail. These results show that the optical response of Sn-doped β-Ga₂O₃ should be interpreted within an orientation-dependent framework rather than as an orientation-independent band-edge property. Polarized Raman spectroscopy provides direct evidence that the vibrational response of β-Ga₂O₃ is strongly governed by crystallographic orientation, Raman tensor projection, and mode-specific anisotropy. The (001)-oriented wafers preserve more stable and reproducible angular Raman fingerprints across the investigated carrier-concentration range, whereas the (201)-oriented wafers exhibit stronger doping-dependent redistribution of the anisotropic Raman response. Raman linewidths remain nearly unchanged with azimuthal angle and Sn concentration, indicating that phonon coherence is largely preserved despite high donor incorporation. In addition, a broad Raman feature near 257 cm⁻¹ is resolved only in the Sn-doped (201)-oriented samples. Rather than assigning this feature unambiguously to a Sn-specific local vibrational mode, it is more cautiously interpreted as a Sn-concentration-enhanced and carrier-concentration-related Raman response whose visibility is strongly affected by crystallographic orientation. Overall, the present results demonstrate that the structural, optical, and Raman responses of Sn-doped β-Ga₂O₃ cannot be evaluated independently of crystallographic orientation. The (001) orientation provides more stable structural and Raman anisotropy fingerprints, whereas the (201) orientation is more sensitive to donor-concentration-related vibrational reorganization. These findings provide useful guidance for orientation-aware characterization, substrate selection and process monitoring in β-Ga₂O₃-based ultrawide-bandgap electronic and optoelectronic materials.
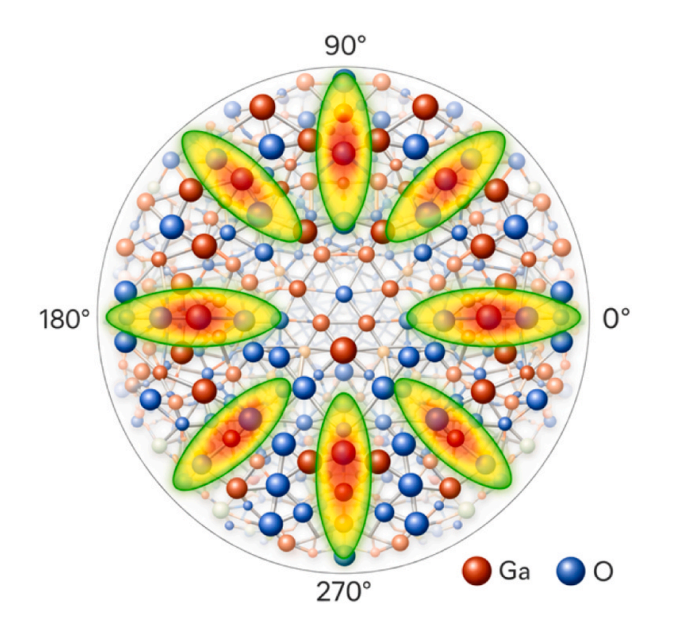
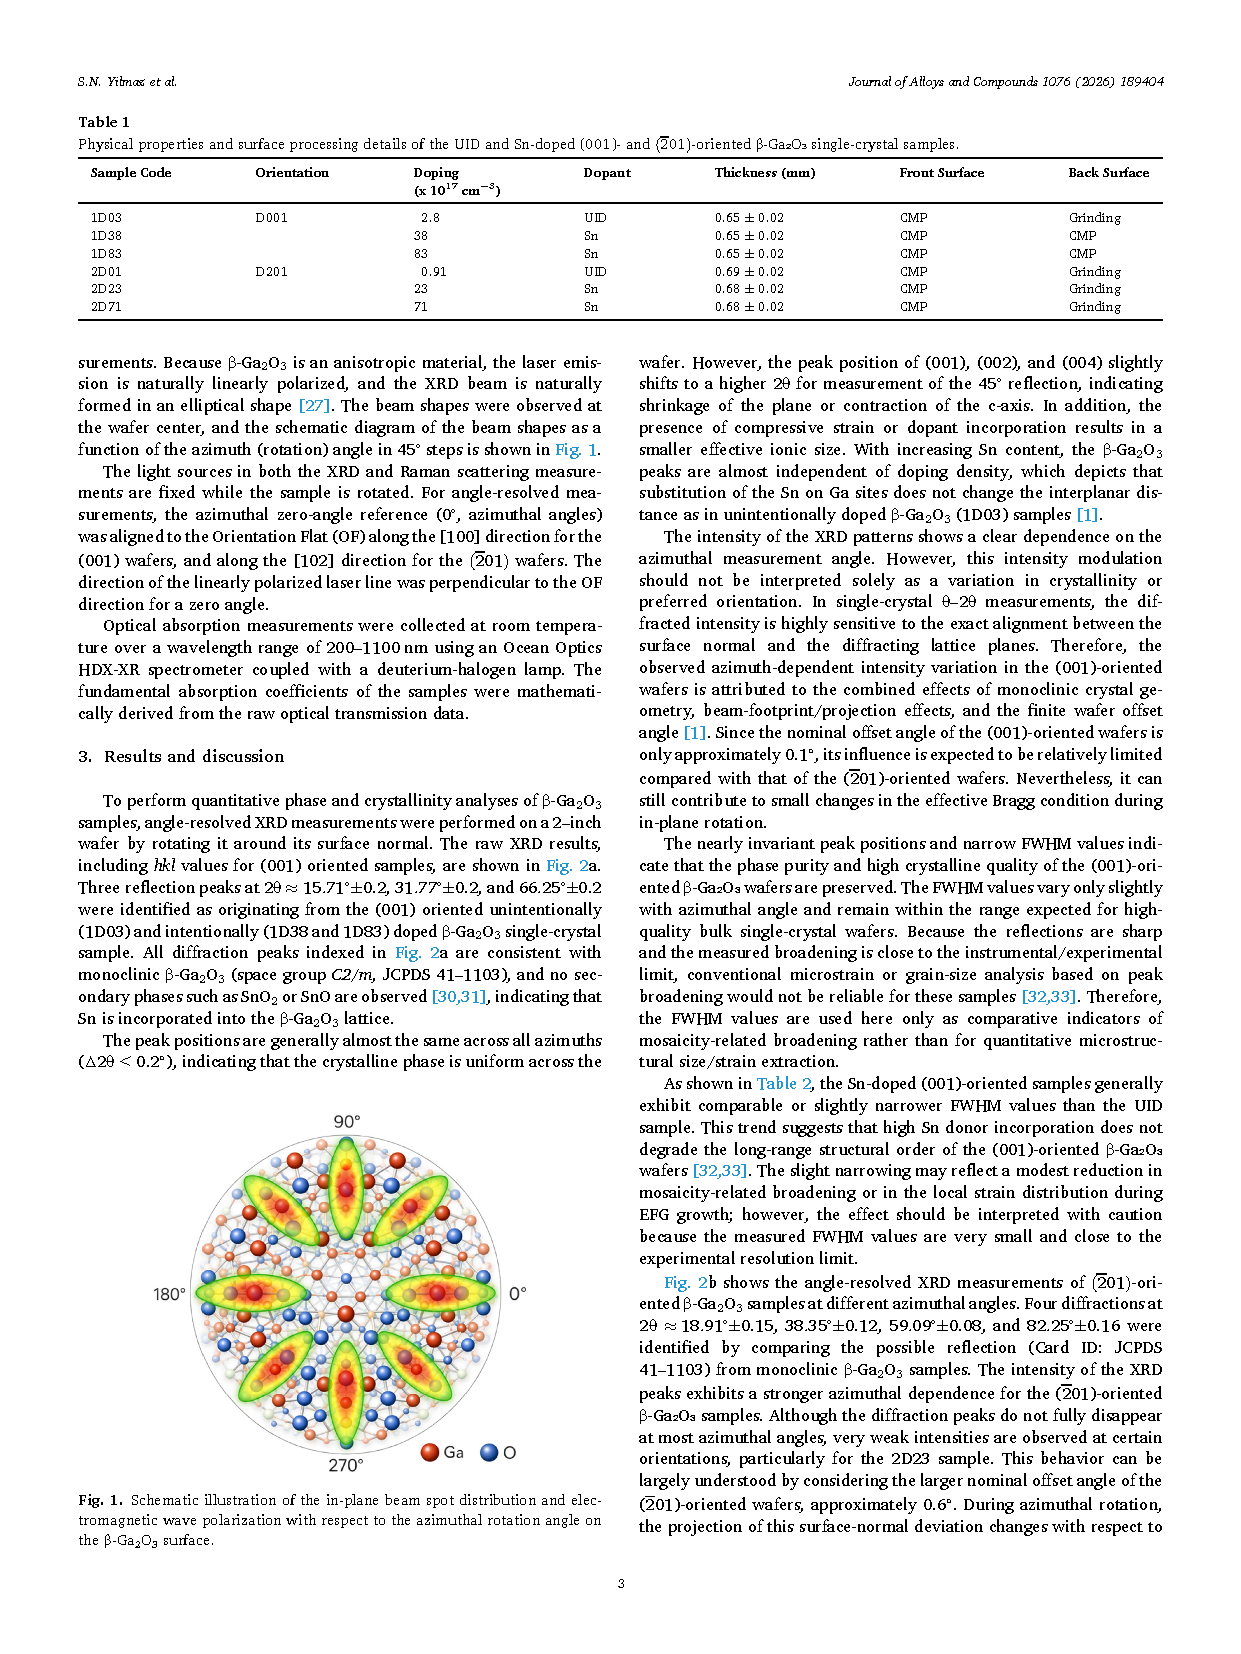
Fig. 1. Schematic illustration of the in-plane beam spot distribution and electromagnetic wave polarization with respect to the azimuthal rotation angle on β-Ga₂O₃
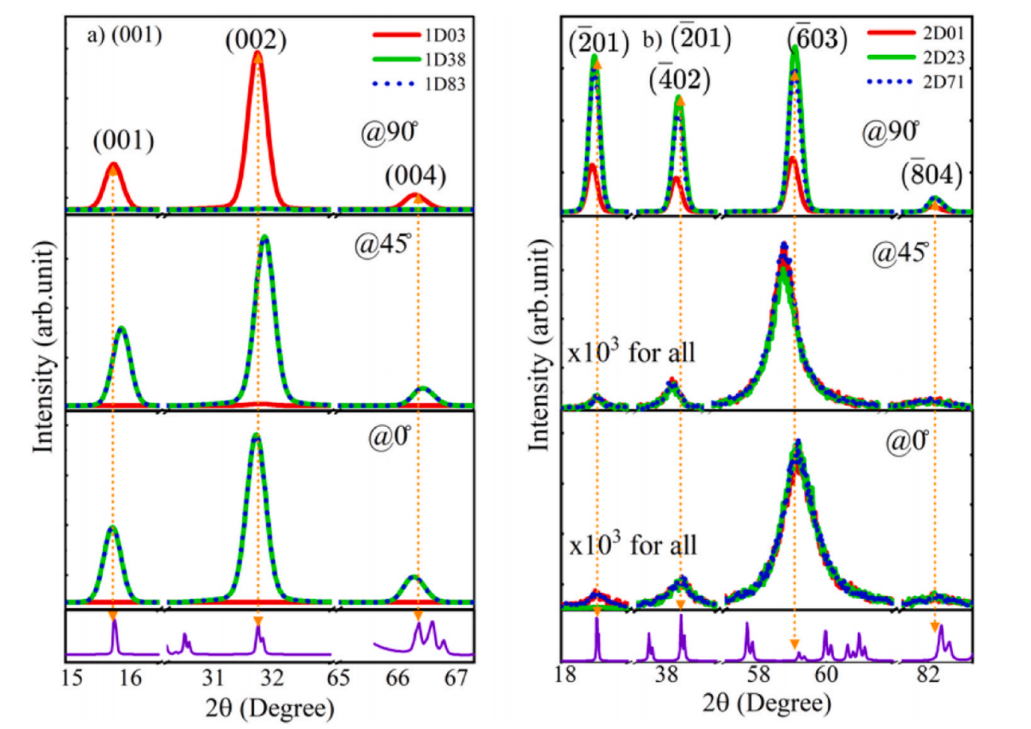
Fig. 2. Angle-resolved X-ray diffraction (XRD) spectra of the (a) (001)-oriented and (b) (201)-oriented undoped and Sn-doped β-Ga₂O₃ samples. The XRD diffraction peak positions are depicted on a broken axis, and certain profiles are multiplied by a constant factor for visual clarity. The violet solid lines at the bottom of both graphs correspond to the standard reference patterns calculated from the JCPDS 41–1103 card. Dotted lines serve as a guide to the eye
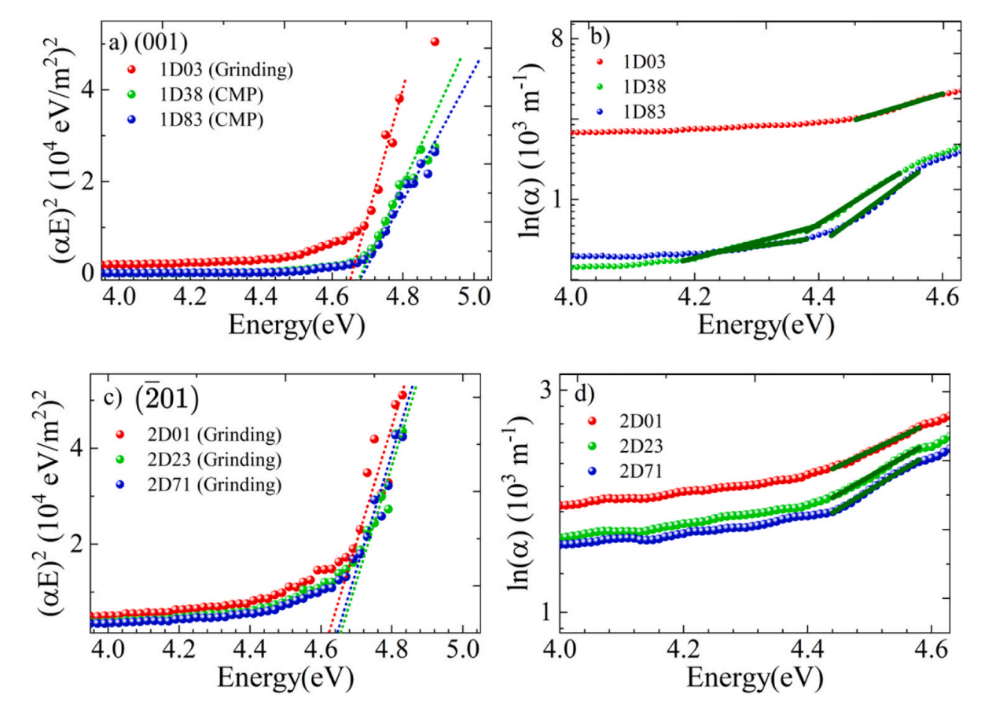
Fig. 3. Optical absorption analysis of the (001) and (201)-oriented β-Ga₂O₃ samples. (a) and (c) are Tauc plots ((αE)² versus photon energy) showing the fundamental absorption edge, and (b, d) logarithmic absorption-tail behavior (ln (α) versus photon energy) for the (001) and (201) series, respectively. Dotted and solid lines represent the linear fits for bandgap extraction and the energy state below the band edge, respectivel
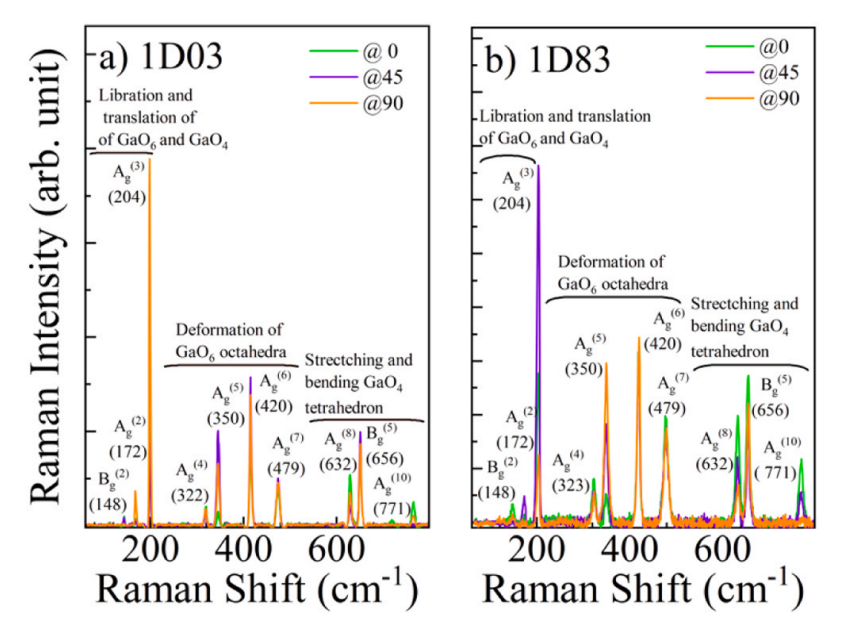
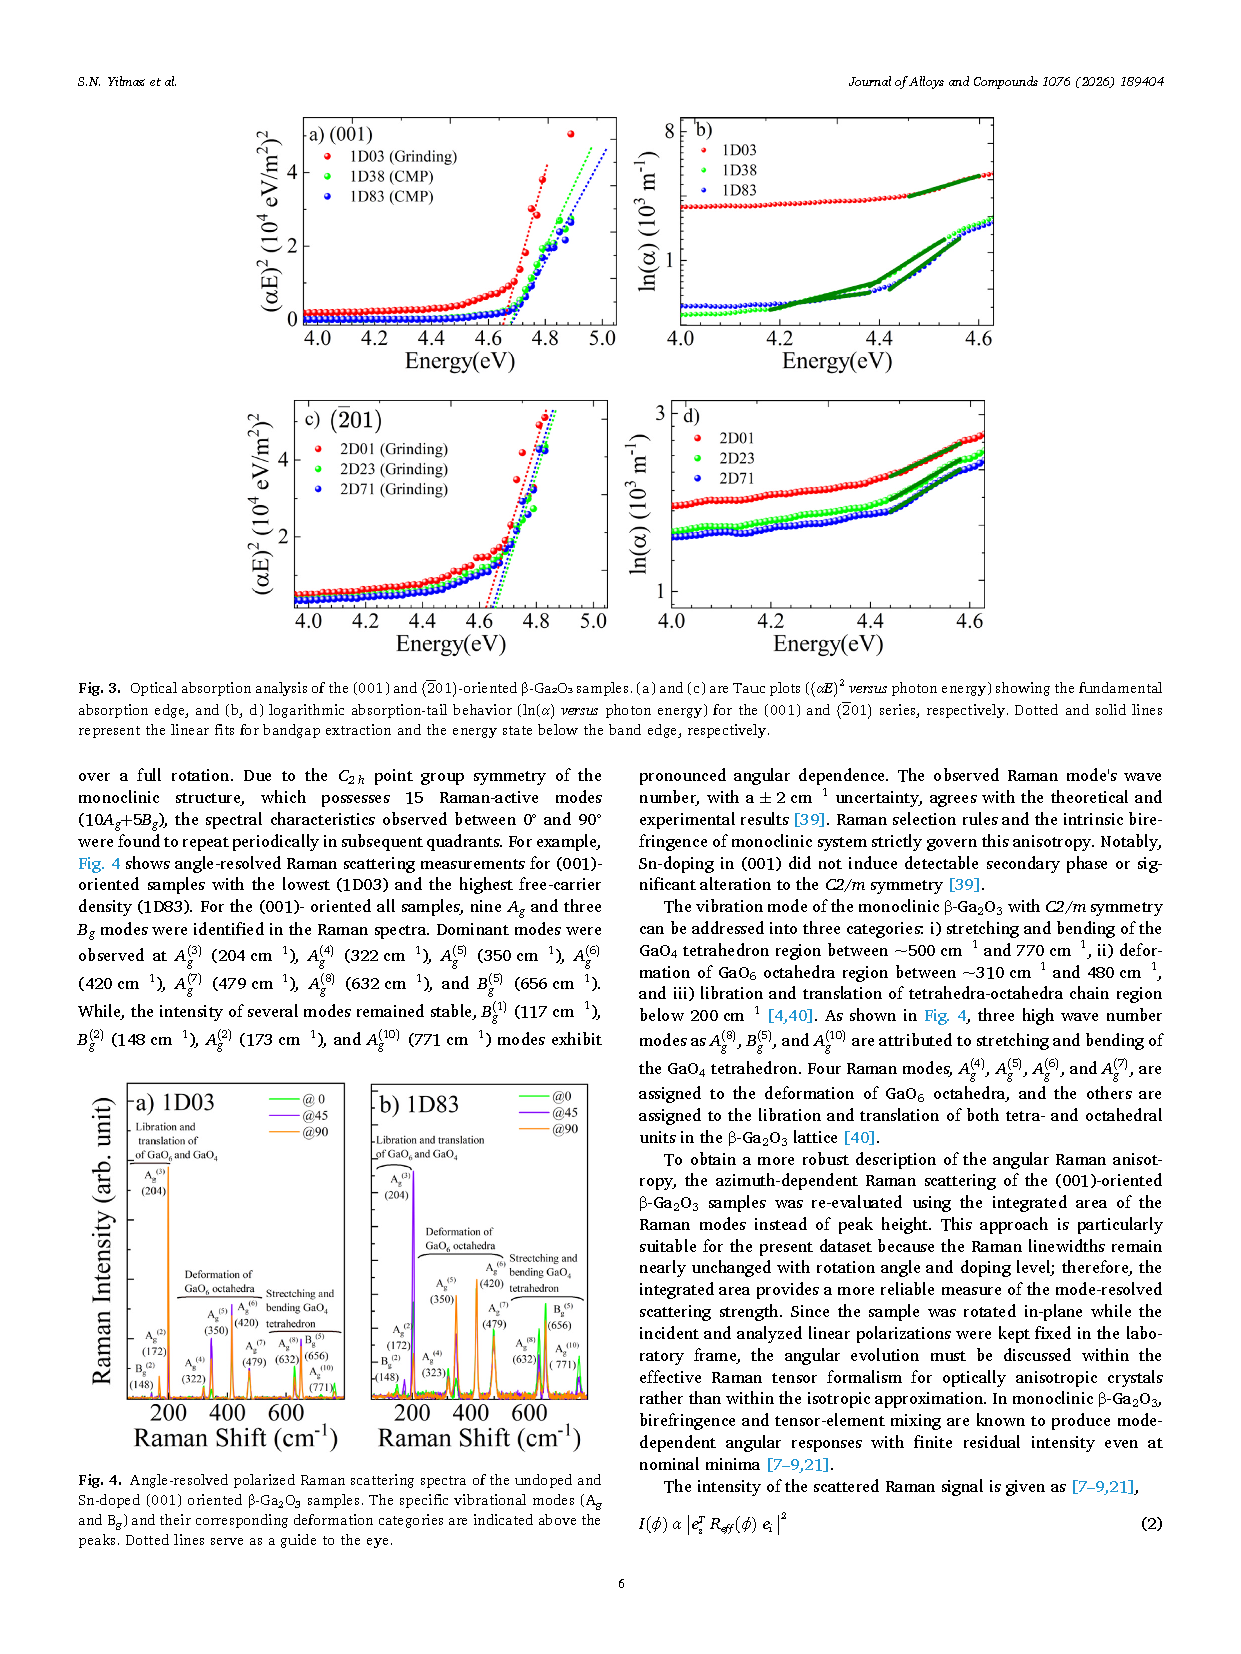
Fig. 4. Angle-resolved polarized Raman scattering spectra of the undoped and Sn-doped (001)-oriented β-Ga₂O₃ samples, showing characteristic Ag and Bg peaks. Dotted lines serve as a guide to the eye
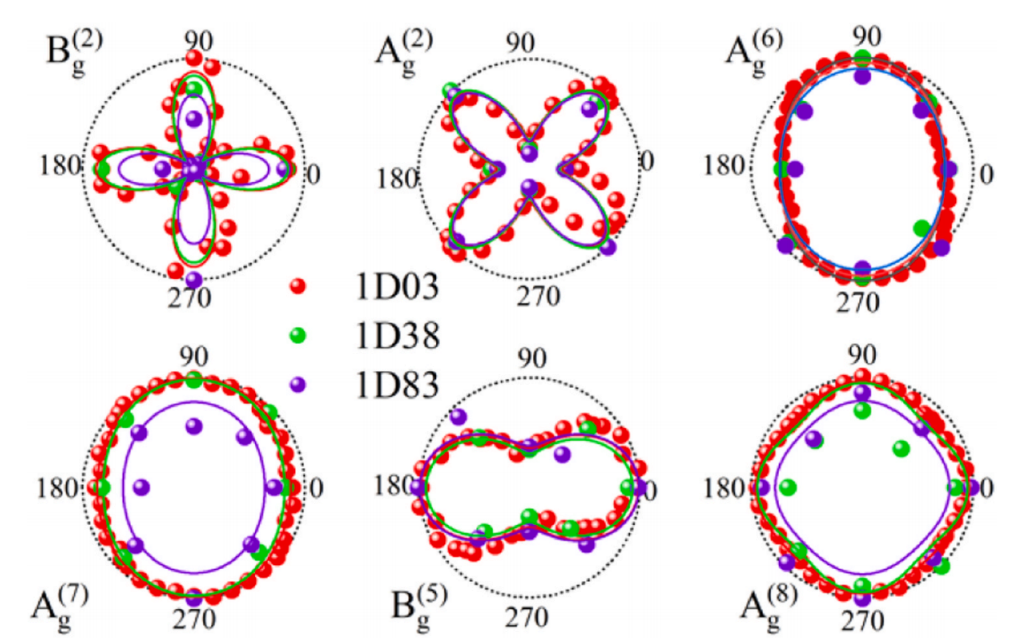
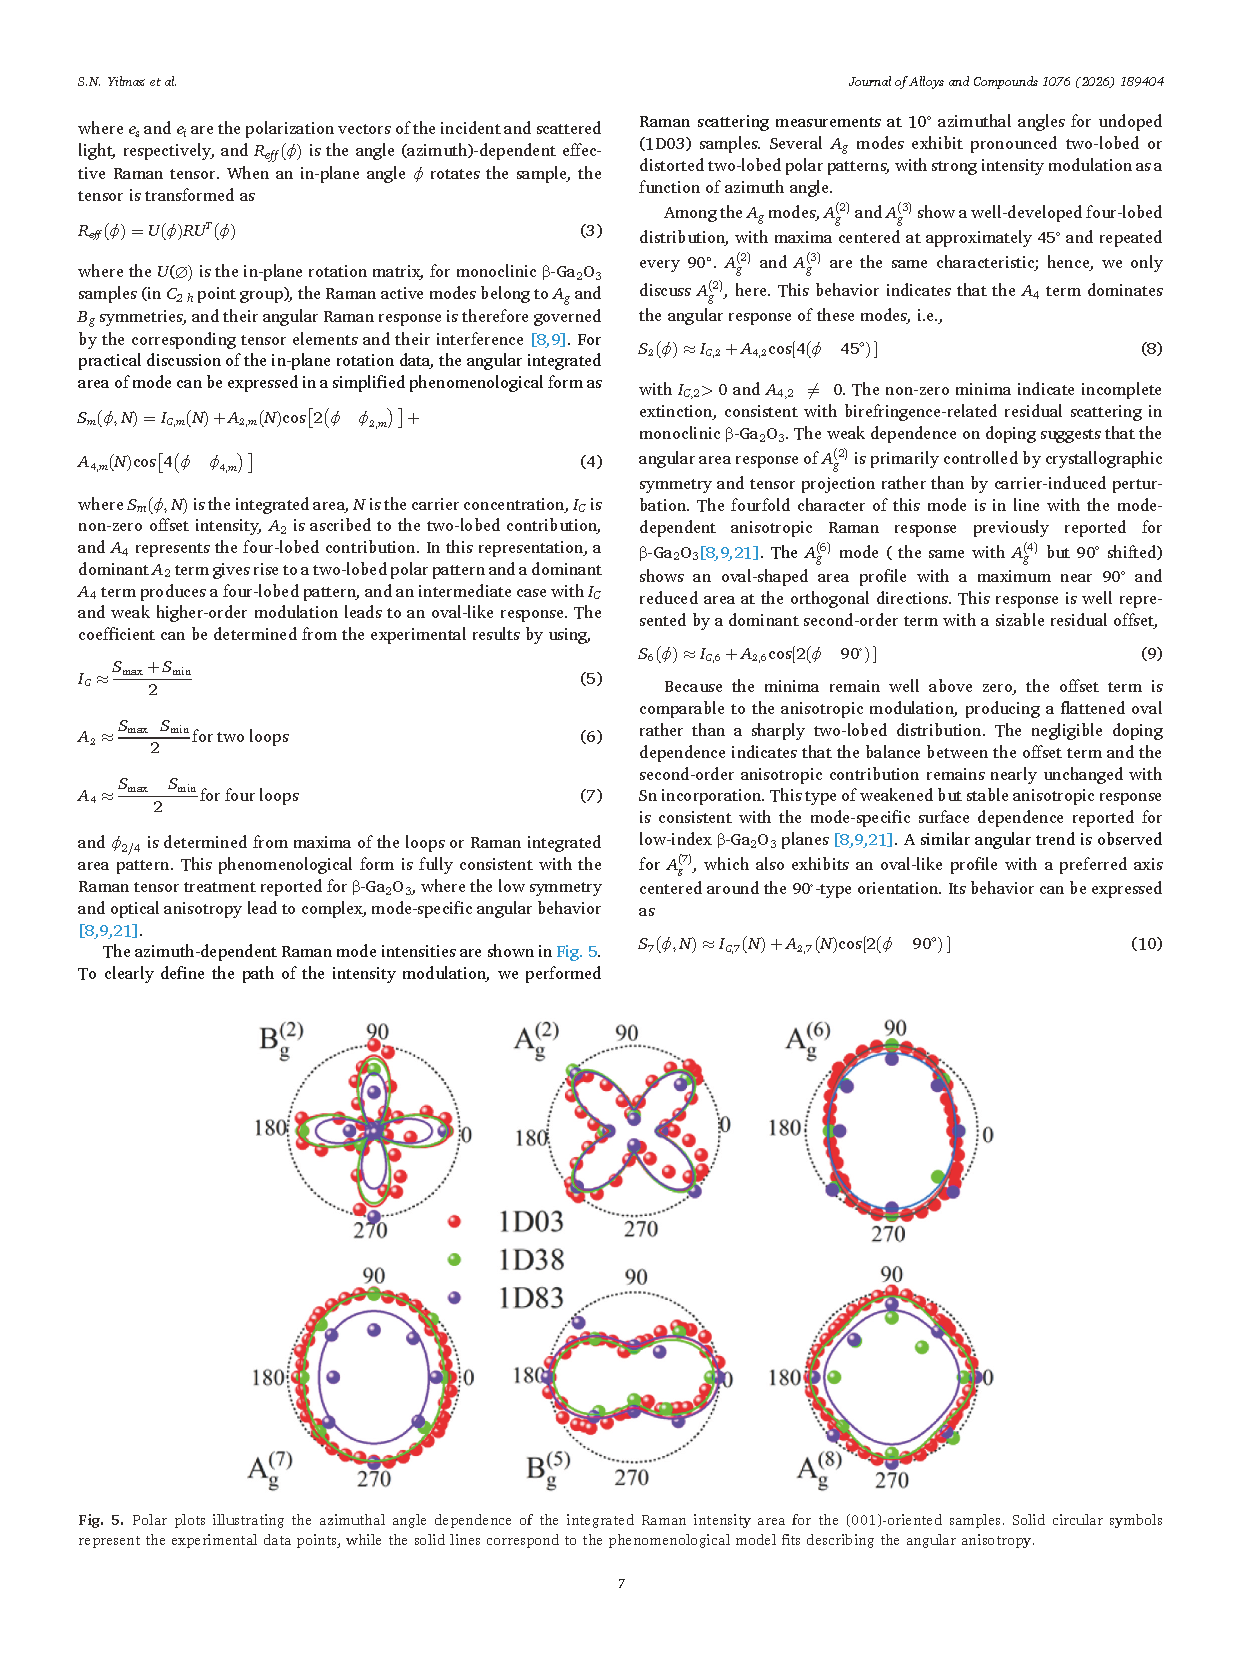
Fig. 5. Polar plots illustrating the azimuthal angle dependence of the integrated Raman intensity area for the (001)-oriented samples. Solid circular symbols represent the experimental data points, while the solid lines correspond to the phenomenological model fits describing the angular anisotropy
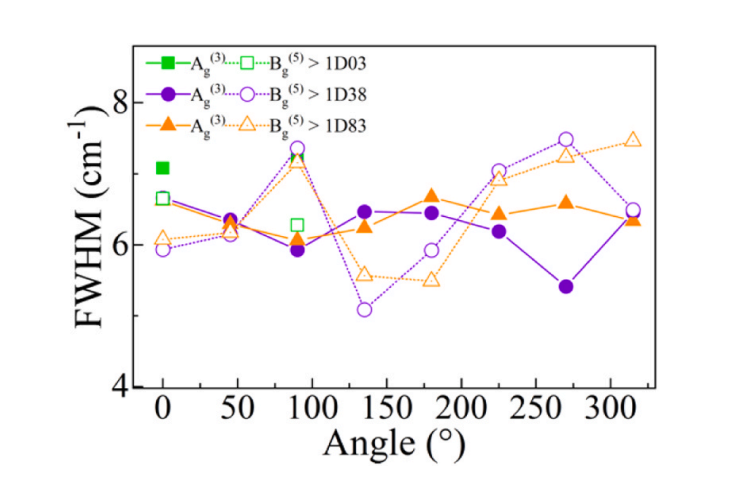
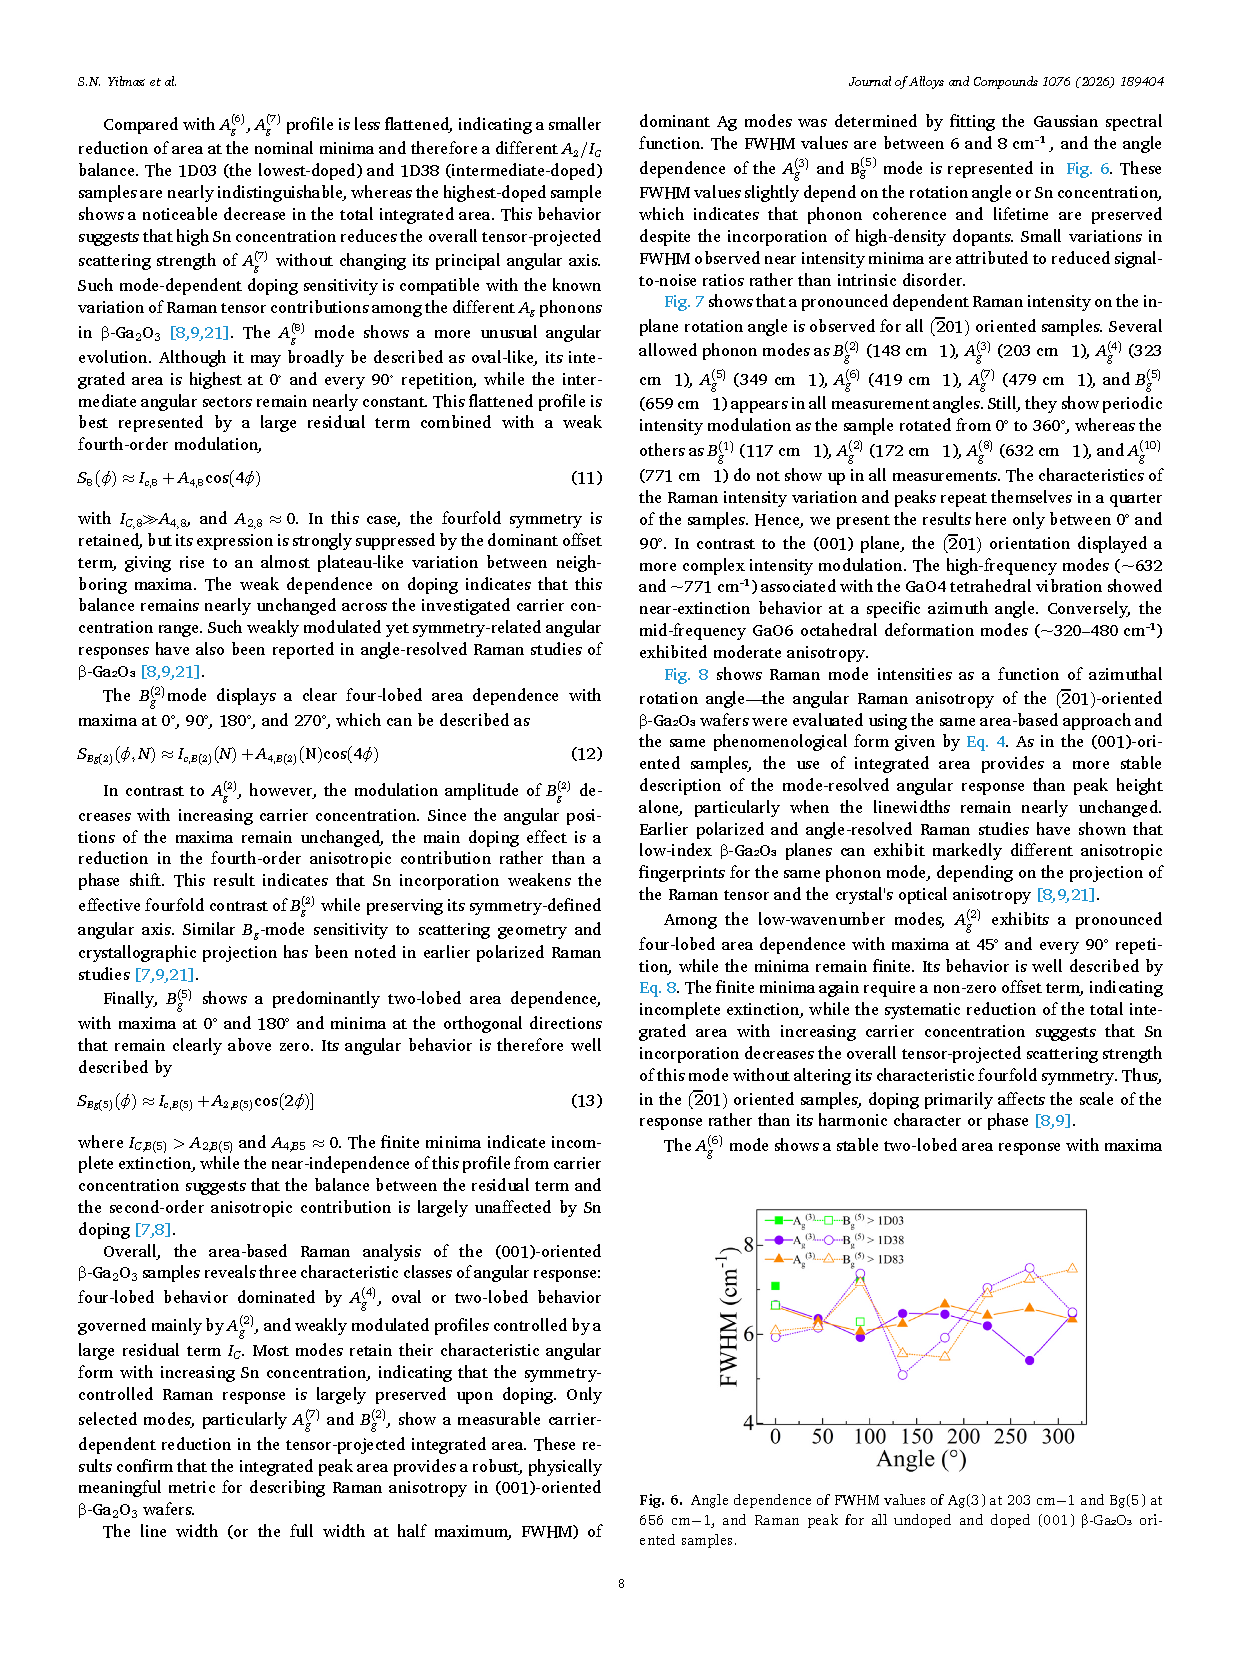
Fig. 6. Angle dependence of FWHM values of Ag (3) at 203 cm⁻¹ and Bg (5) at 656 cm⁻¹ Raman peak for all undoped and Sn-doped (001)-oriented β-Ga₂O₃ samples
DOI :
10.1016/j.jallcom.2026.189404
Instruction
Official Account

Cooperation
Top