


Researchers from Hubei University, Southern University of Science and Technology have published a dissertation titled "High Dynamic Range 120 dB Ga₂O₃-In₂Se₃ Photodetector Array by Ferroelectric Polarization Enhancement" in Small.
Background
Solar-blind ultraviolet photodetectors are essential for civil and military applications such as flame monitoring, missile early warning and ozone detection. β-Ga₂O₃ is a promising candidate due to its intrinsic solar-blind bandgap. Conventional Ga₂O₃ devices suffer poor weak-light sensitivity and narrow linear dynamic range, failing to work under mixed strong/faint UV illumination. Traditional heterojunctions only rely on static band alignment, leading to severe carrier recombination. Two-dimensional α-In₂Se₃ shows intrinsic room-temperature ferroelectricity to dynamically tune interfacial barrier. However, existing works study ferroelectricity and photodetection separately, without constructing polarization-tunable Ga₂O₃-In₂Se₃ heterostructures. Most researches only fabricate discrete devices, lacking uniform imaging arrays and systematic mechanism study on ferroelectric-enhanced wide dynamic range detection, which creates an obvious research gap.
Abstract
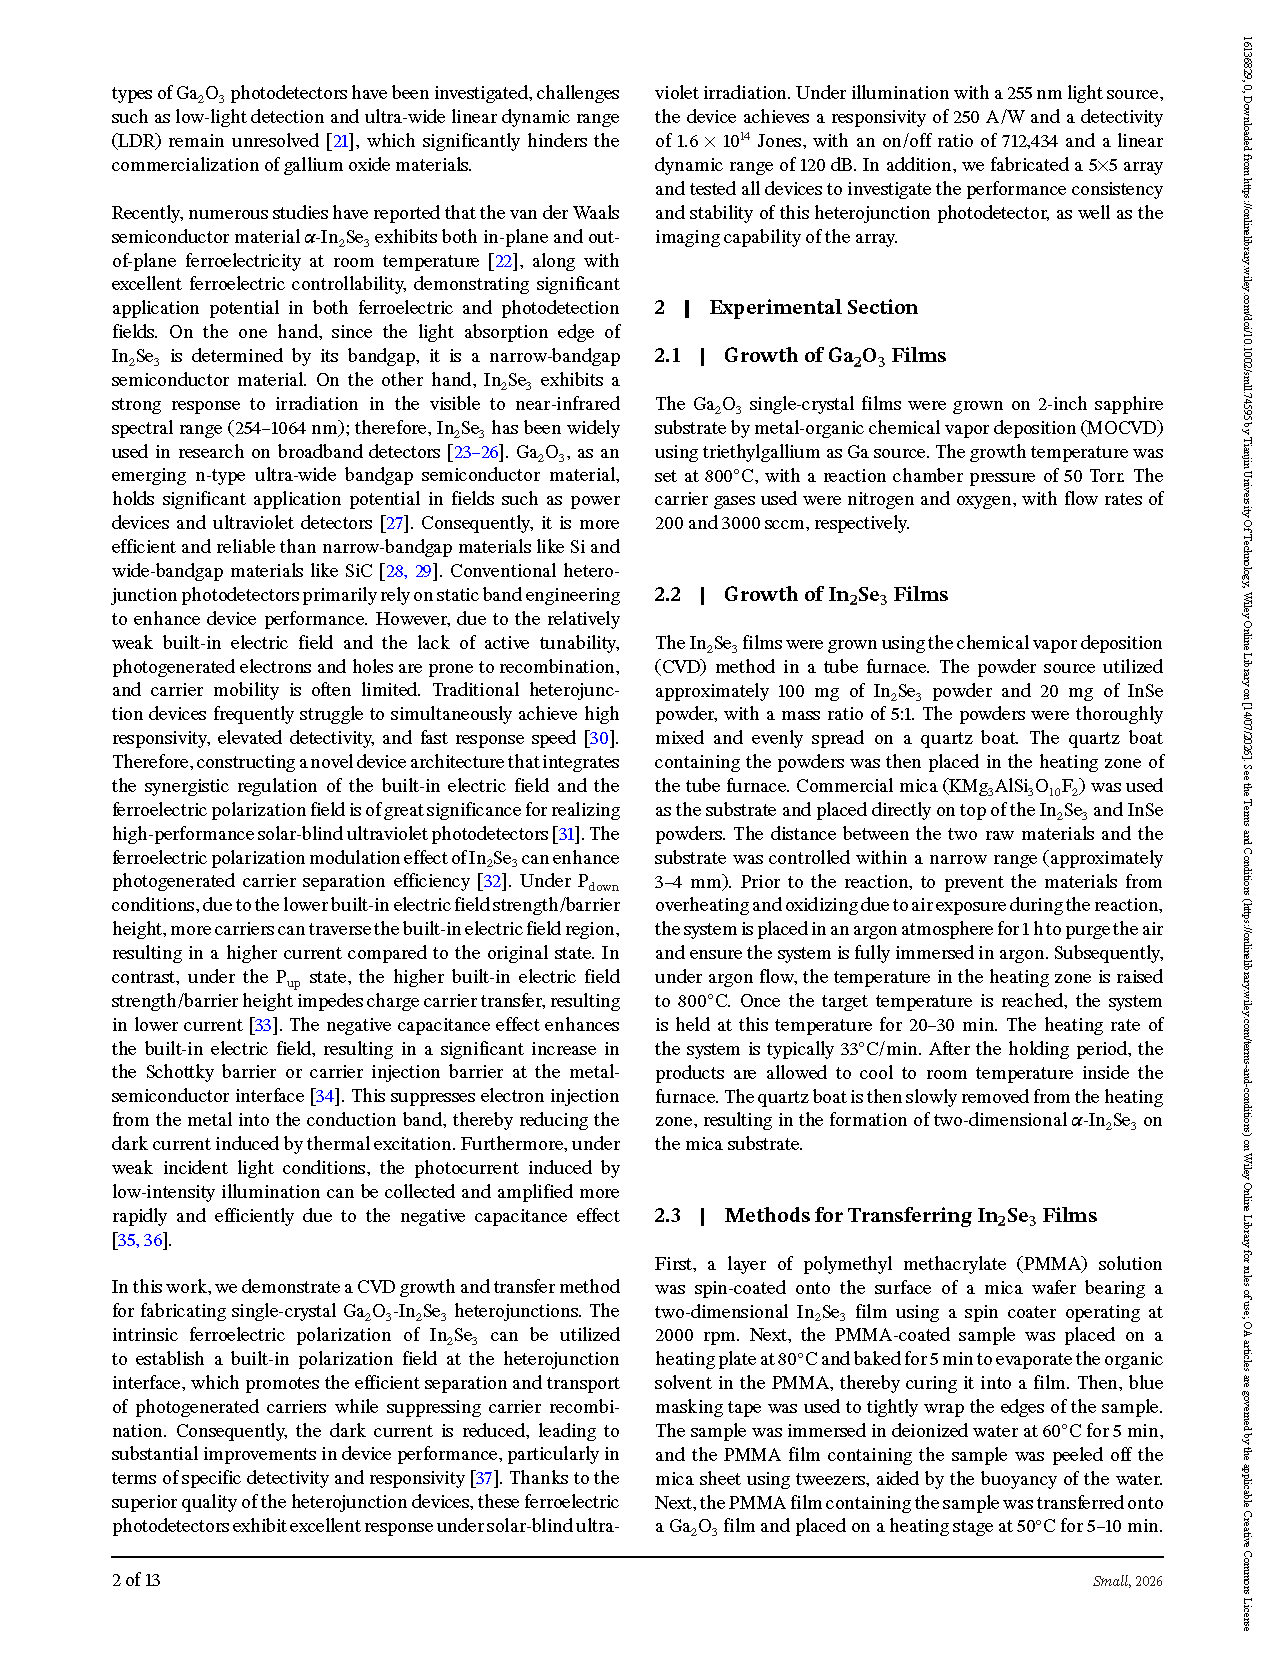
Gallium oxide-based photodetectors have specialized applications in both civilian and military fields due to their excellent spectral selectivity for solar-blind ultraviolet (SBUV) light. However, gallium oxide photodetectors still face challenges in weak-light detection capability, which hinders their further commercialization. Here, we devised a Ga₂O₃-In₂Se₃ single-crystal van der Waals heterojunction photodetector by using the polarization modulation effect of ferroelectric semiconductors. Under illumination with a 255 nm light, the Ga₂O₃-In₂Se₃ photodetector achieves an on/off ratio of 712,434 and a detectivity of 1.6 ×10¹⁴ Jones, with a linear dynamic range (LDR) of 120 dB. Furthermore, we fabricated a 5×5 array and all photodetectors exhibit consistent optoelectronic performance, indicating the imaging application potential of the array. This work provides novel insights for ferroelectric-enhanced solar-blind ultraviolet detectors.
Highlights
Construct Ga₂O₃/α-In₂Se₃van der Waals ferroelectric heterojunction to dynamically regulate interfacial built-in electric field via polarization switching.
Realize ultra-high on/off ratio (712434), detectivity (1.6 ×10¹⁴ Jones) and record 120 dB linear dynamic range for solar-blind photodetectors.
Verify ferroelectric up/down polarization separately suppress dark current and boost photocurrent, clarify corresponding band alignment evolution rule.
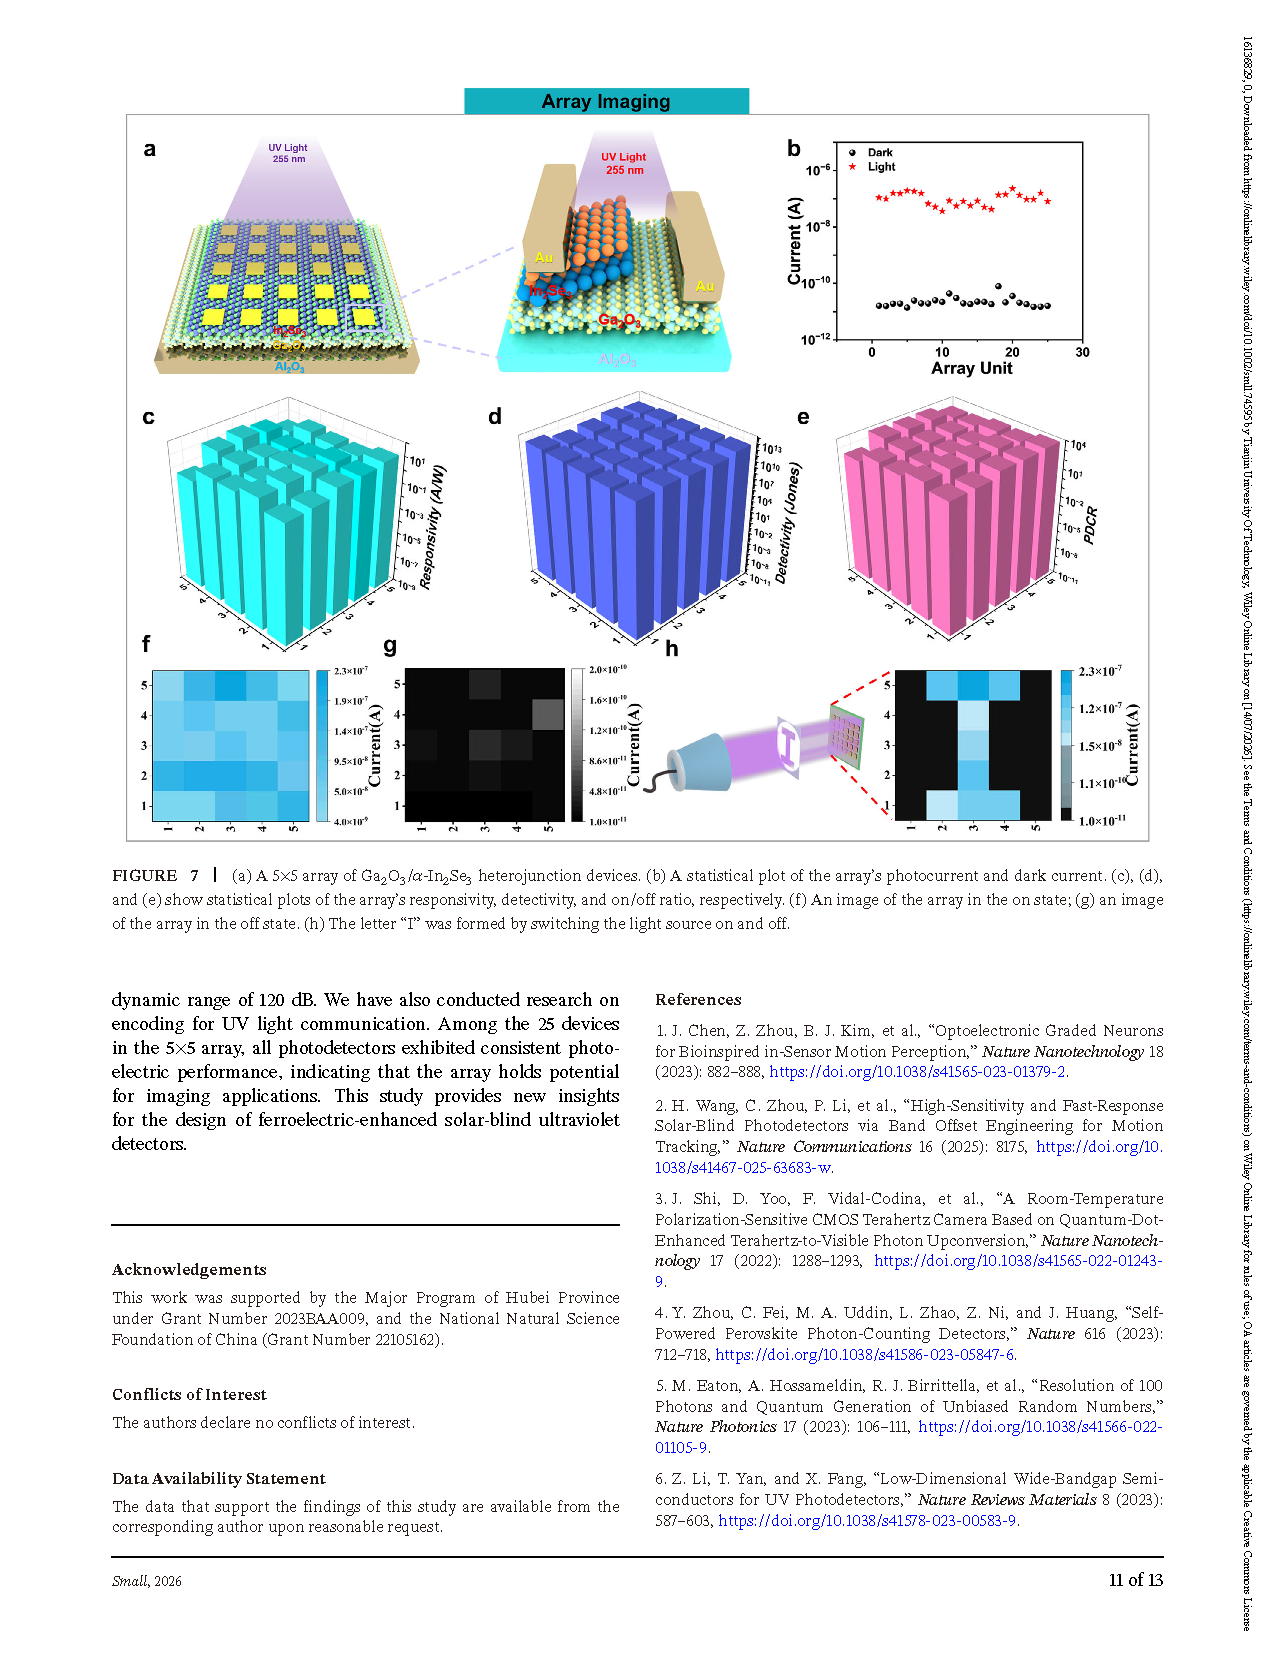
Fabricate uniform 5×5 detector array and demonstrate UV optical communication & two-dimensional imaging functions.
Conclusion
We fabricated a 5×5 array composed of Ga₂O₃-In₂Se₃ single-crystal heterojunction photodetectors. Under 255 nm SBUV light irradiation, the Ga₂O₃-In₂Se₃ photodetector achieved a switching ratio of 712,434, a detection limit of 1.6 ×10¹⁴ Jones, and a linear dynamic range of 120 dB. We have also conducted research on encoding for UV light communication. Among the 25 devices in the 5×5 array, all photodetectors exhibited consistent photoelectric performance, indicating that the array holds potential for imaging applications. This study provides new insights for the design of ferroelectric-enhanced solar-blind ultraviolet detectors.
Project Support
This work was supported by the Major Program of Hubei Province under Grant Number 2023BAA009, and the National Natural Science Foundation of China (Grant Number 22105162).
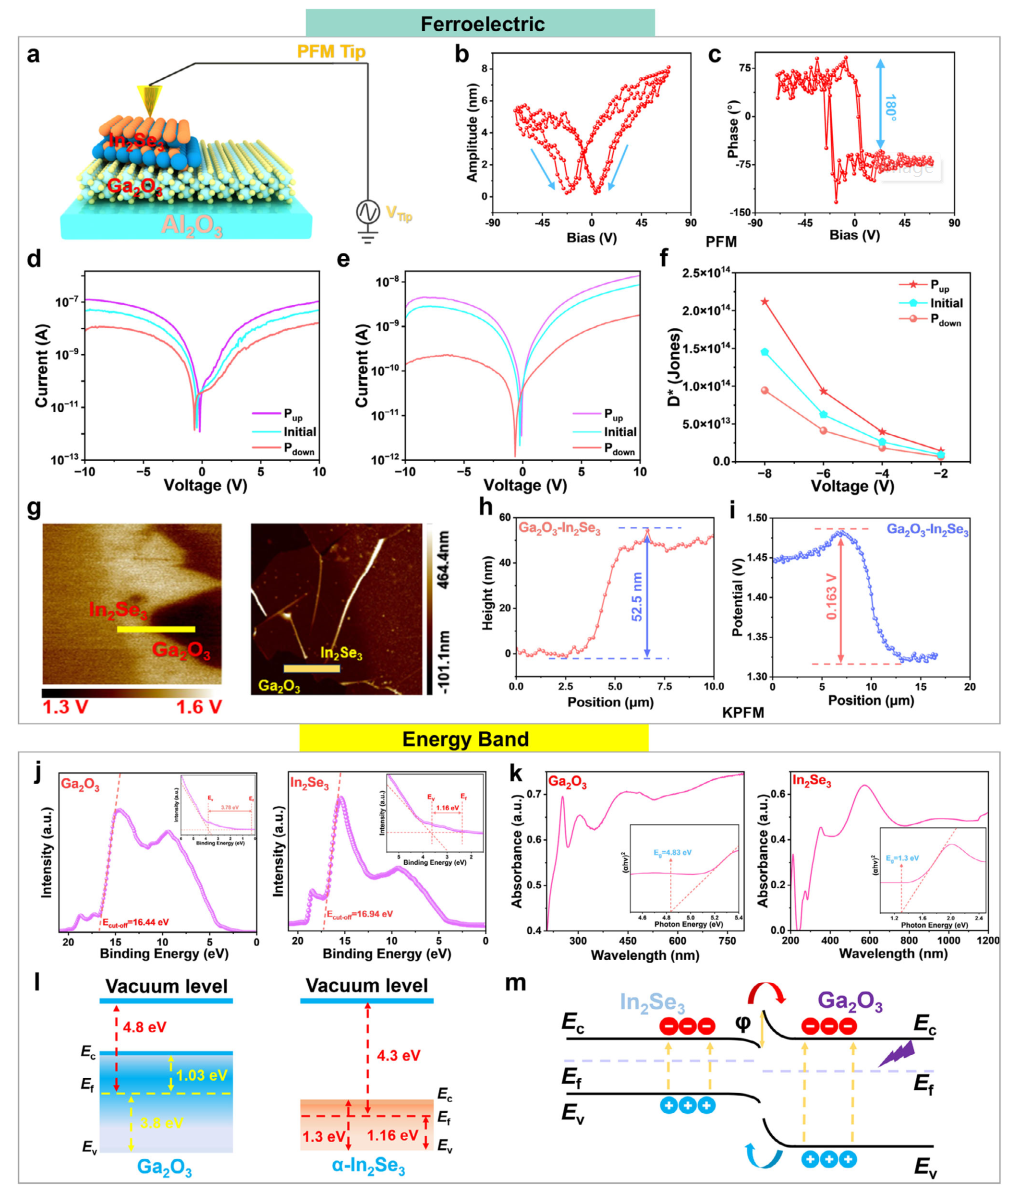
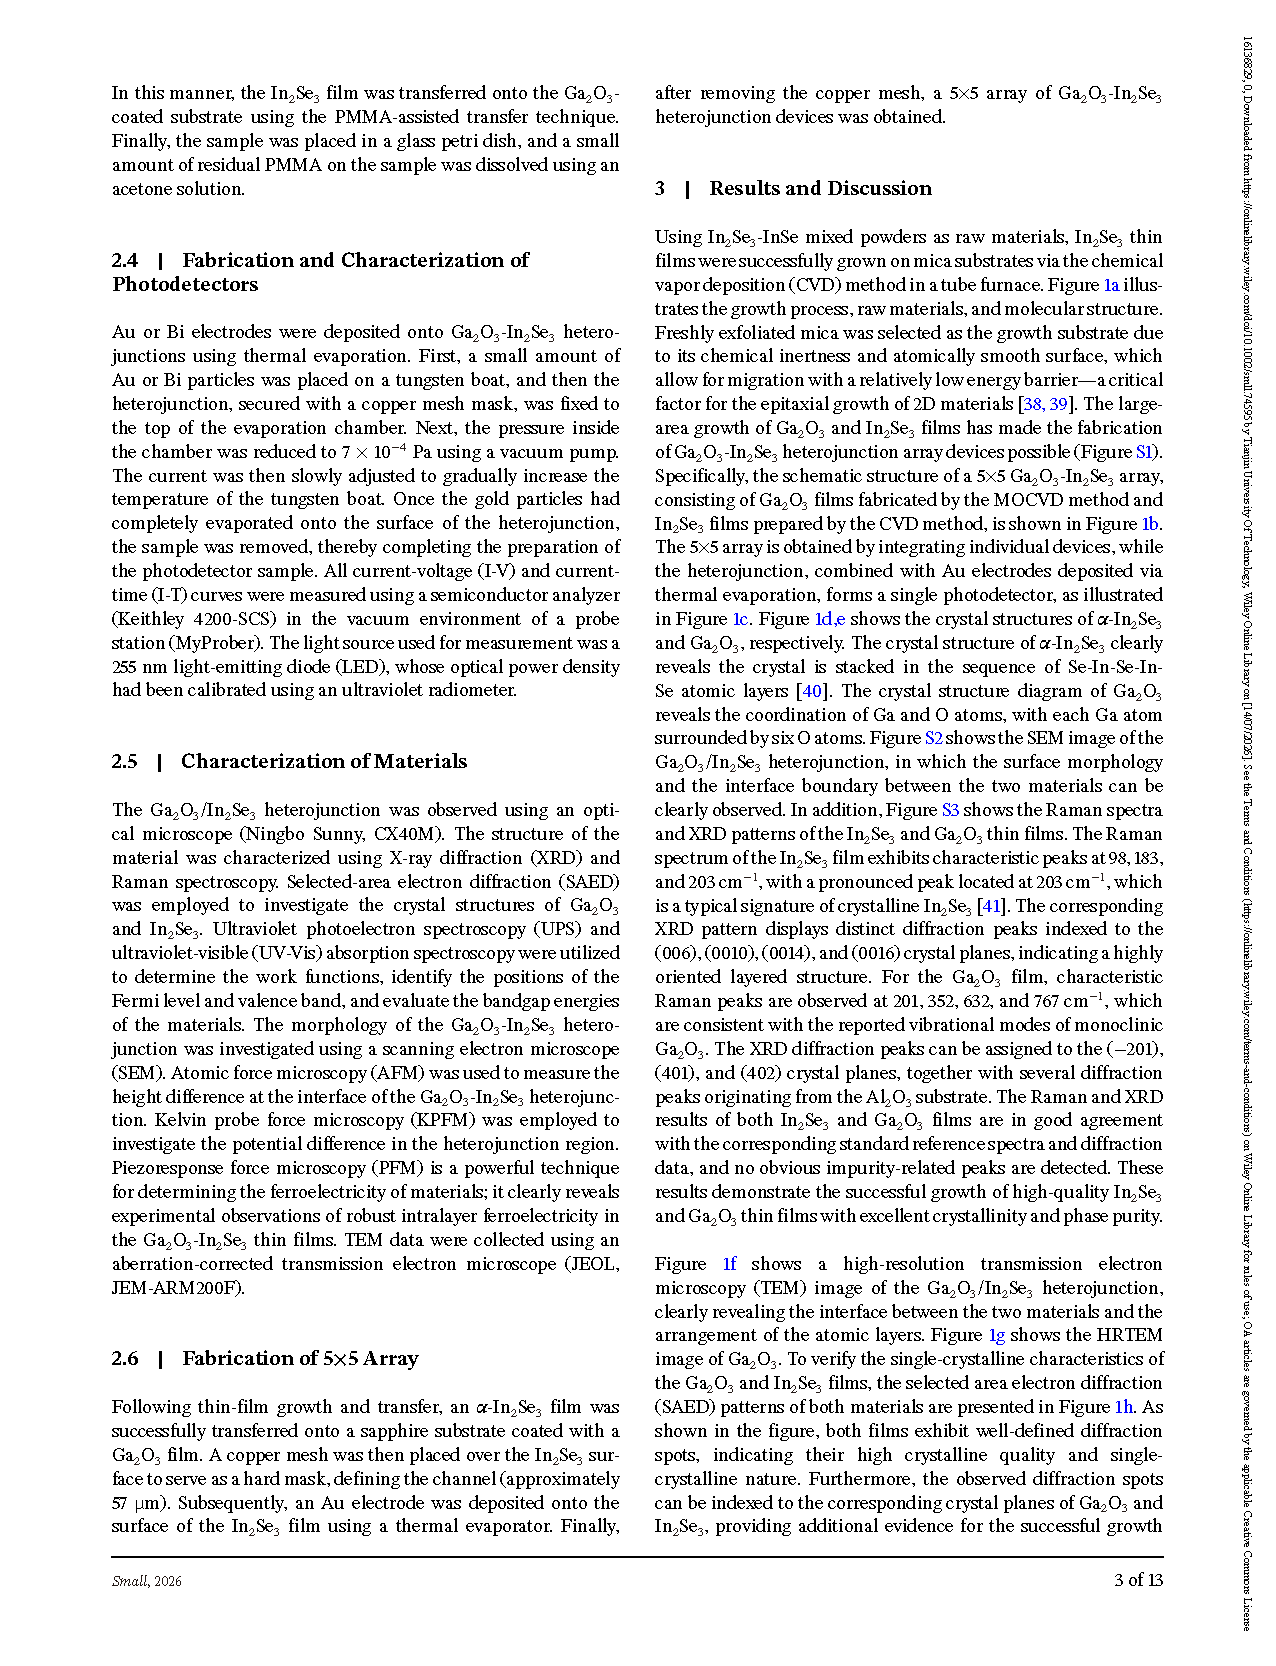
FIGURE 1 Growth process, device fabrication and structural characterization. (a) Schematic diagram of the CVD growth of 2D In₂Se₃. (b) Schematic diagram of a 5×5 Ga₂O₃-In₂Se₃ array and (c) a single device. (d) and (e) show the crystal structures of Ga₂O₃ and In₂Se₃, respectively. (f) HRTEM image of the Ga₂O₃-In₂Se₃ interface. (g) HRTEM image of the Ga₂O₃. (h) SAED patterns of Ga₂O₃ and In₂Se₃. (i) HAADF-STEM image of Ga₂O₃. (j) HAADF-STEM image of In₂Se₃. (k) HAADF image and the corresponding elemental mapping of Ga/O/In/Se elements.
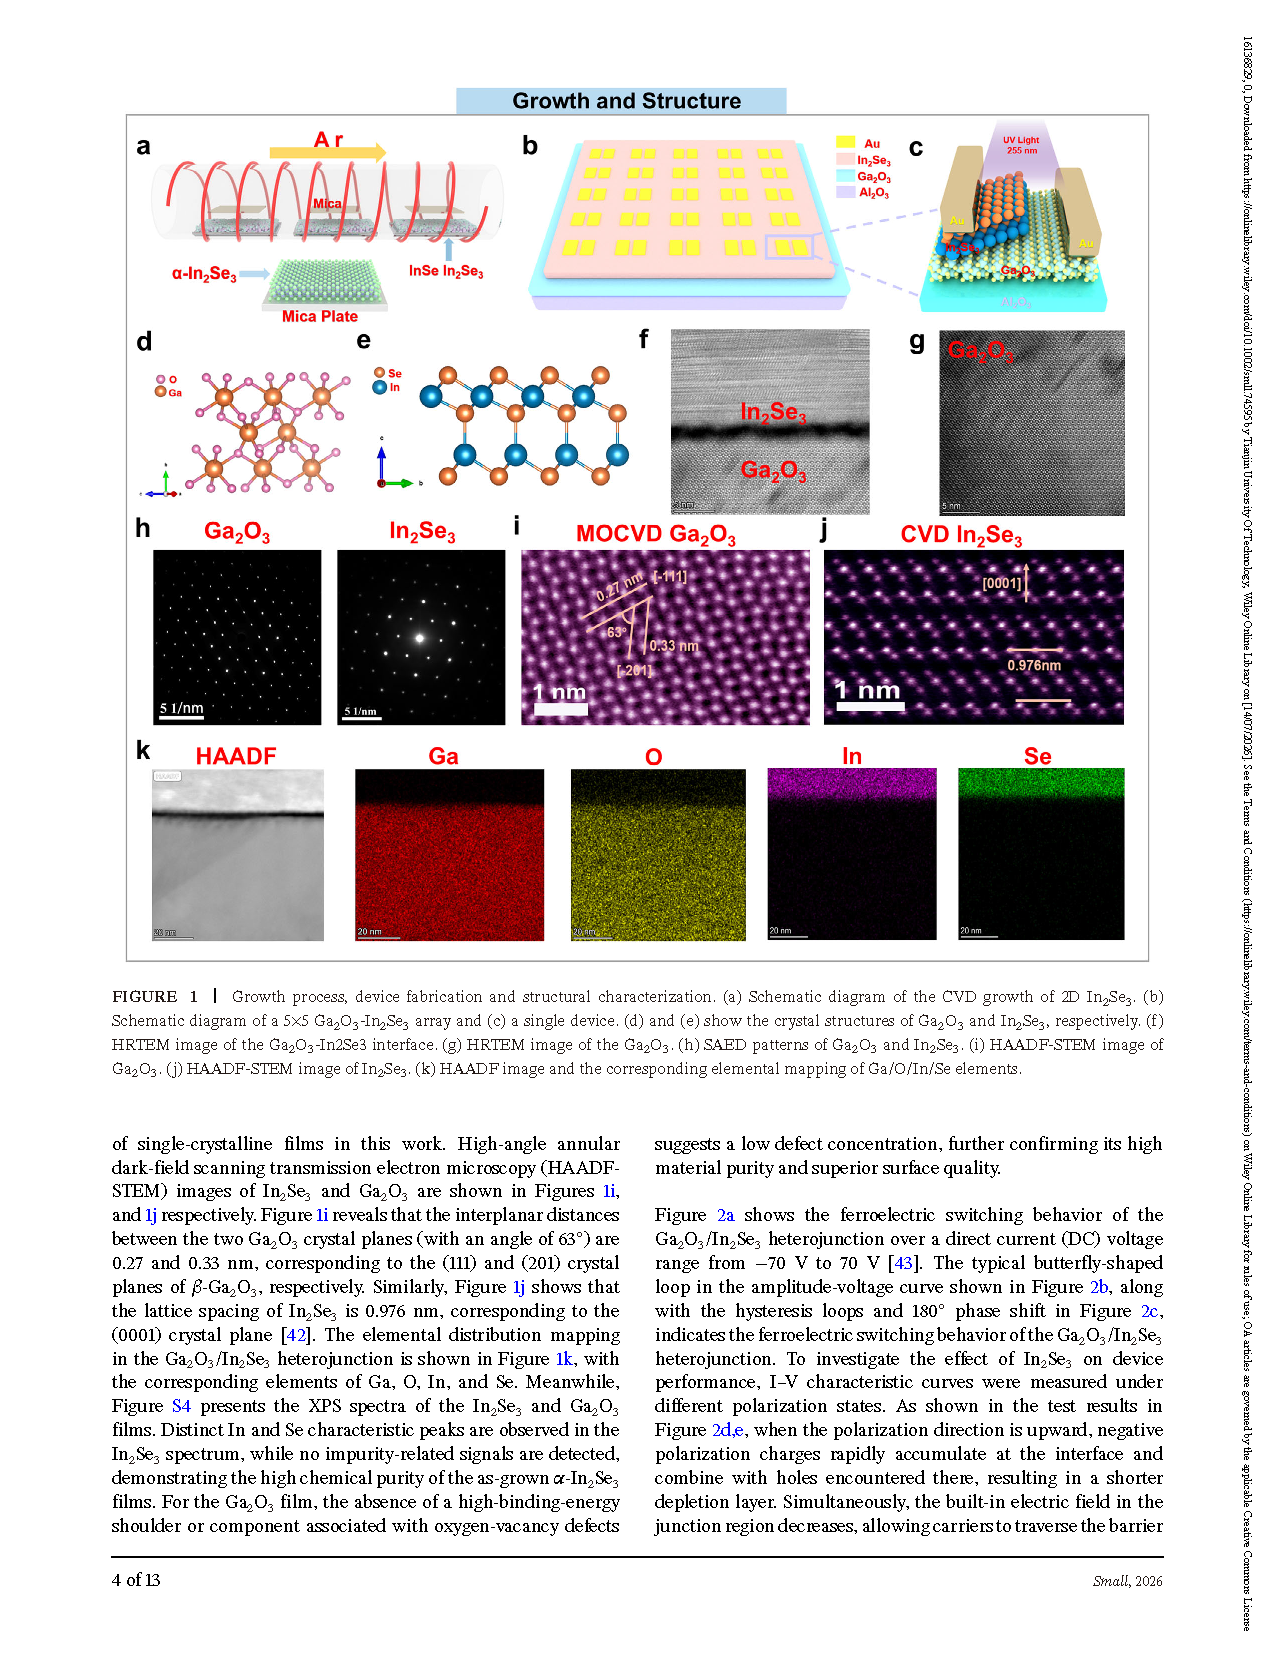
FIGURE 2 Schematic diagram of the PFM measurement. (b) and (c) show the amplitude hysteresis loops and the phase captured at a selected point on the loop, respectively. (d) and (e) show the I–V curves of the device under different bias conditions. (f) shows a comparison of detectivity under different polarization conditions. (g), (h), and (i) show the KPFM images of the Ga₂O₃/In₂Se₃ heterojunction interface, including height and potential profiles. (j) Ultraviolet photoelectron spectroscopy (UPS) spectra of Ga₂O₃ and In₂Se₃. (k) Ultraviolet-visible (UV-Vis) absorption spectra of Ga₂O₃ and In₂Se₃. (l) shows the band structure of Ga₂O₃ and In₂Se₃. (m) shows the band diagram of the heterojunction under illumination.
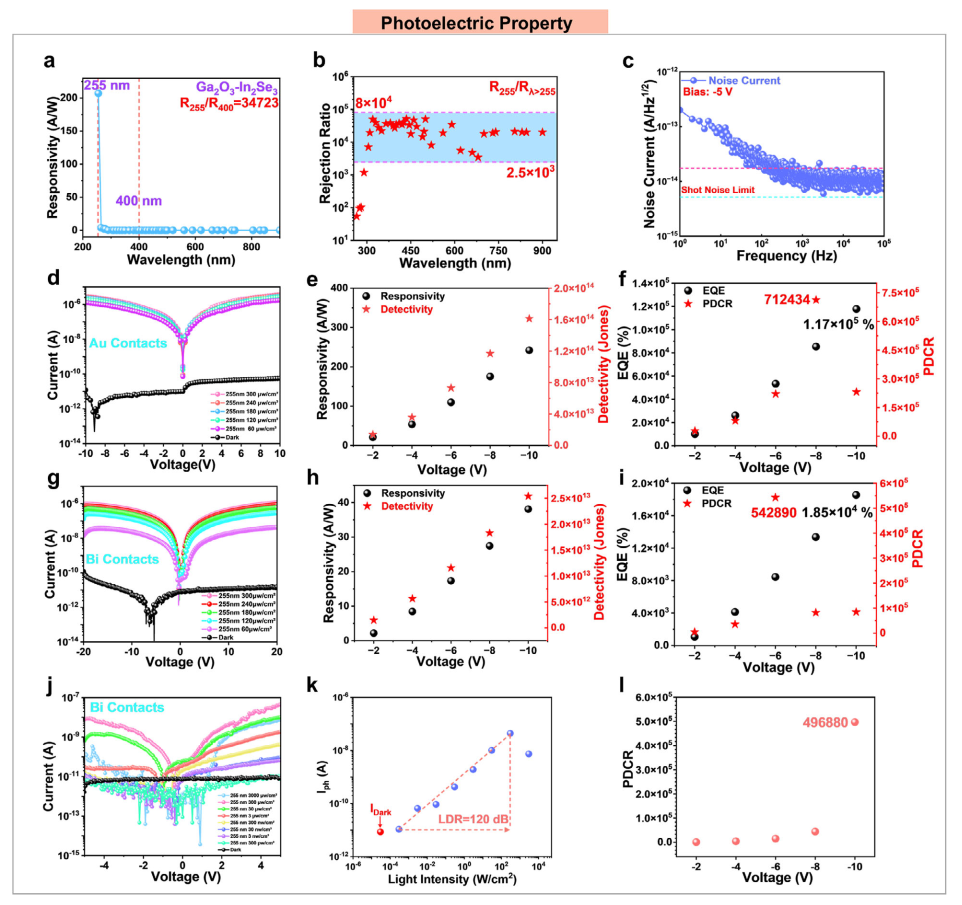
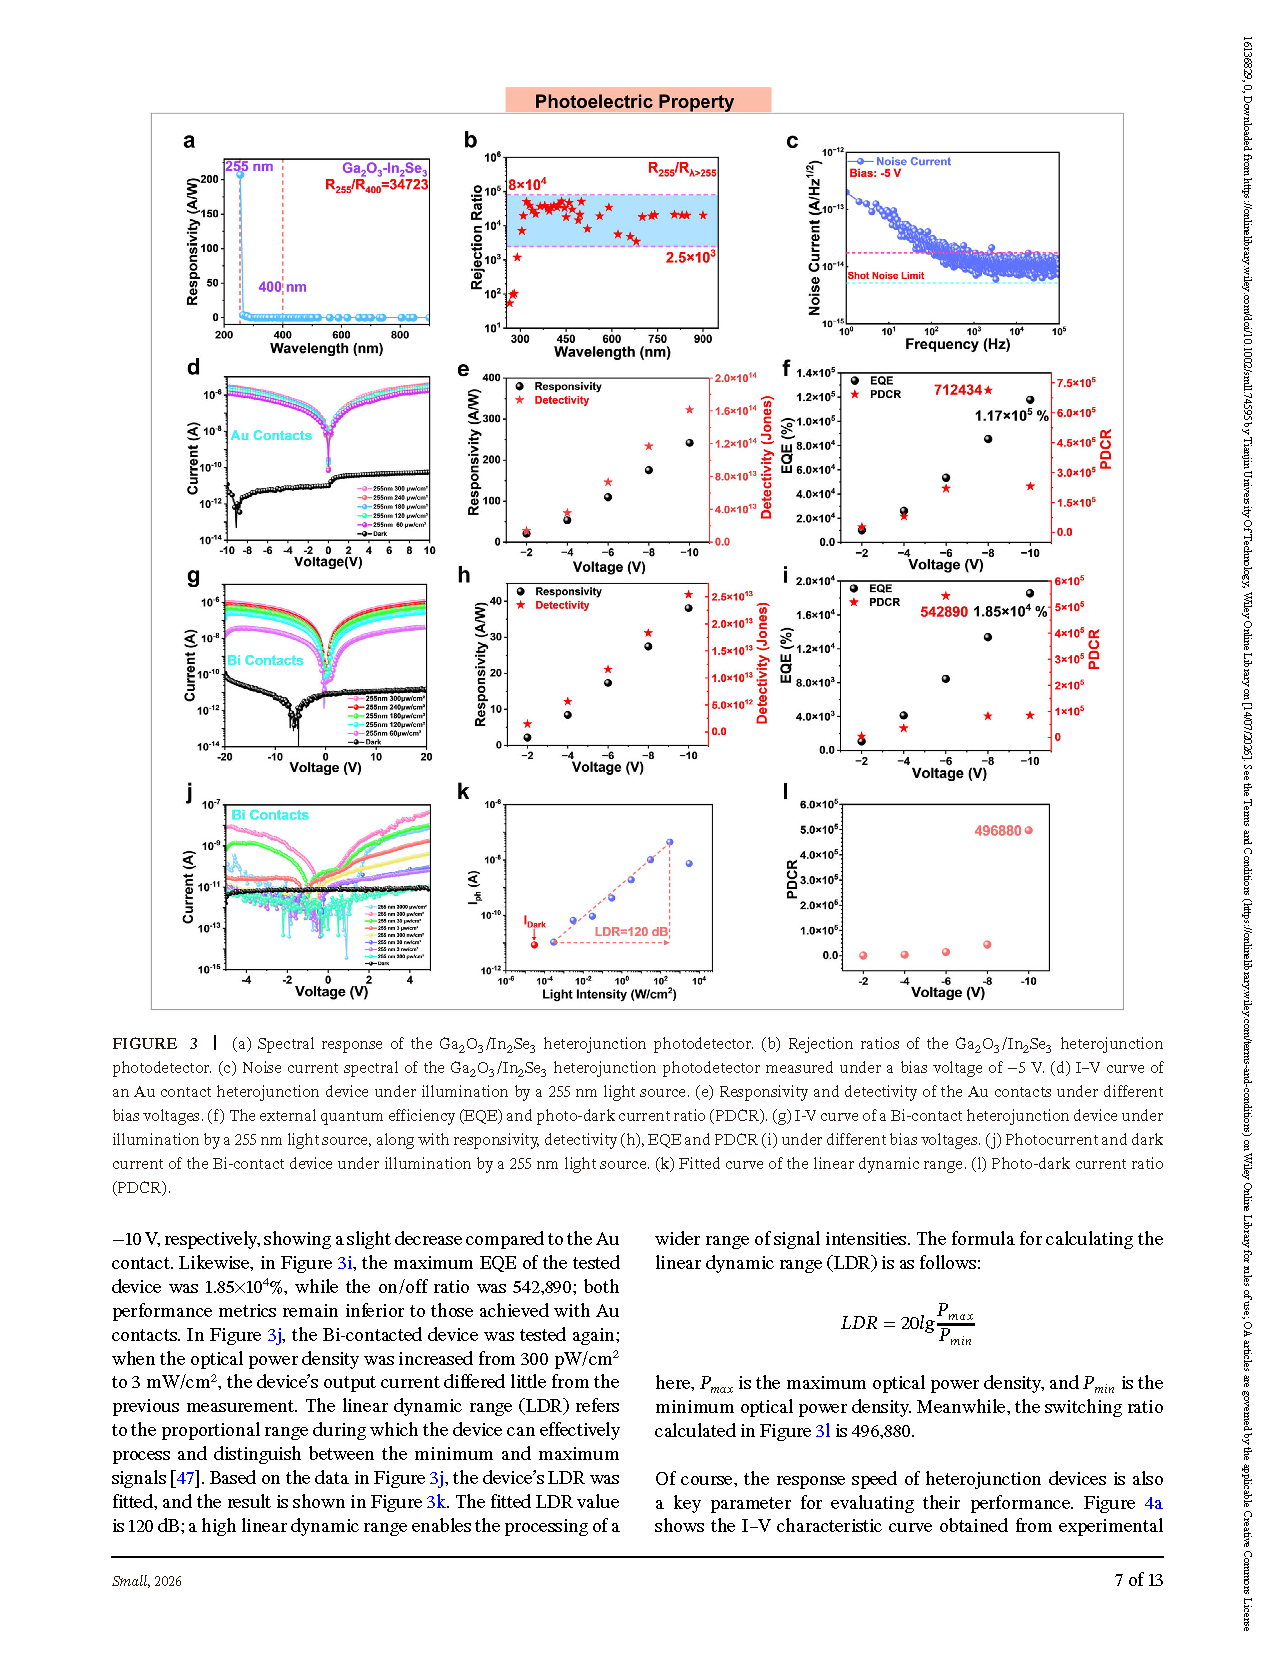
FIGURE 3 (a) Spectral response of the Ga₂O₃/In₂Se₃ heterojunction photodetector. (b) Rejection ratios of the Ga₂O₃/In₂Se₃ heterojunction photodetector. (c) Noise current spectral of the Ga₂O₃/In₂Se₃ heterojunction photodetector measured under a bias voltage of −5 V. (d) I–V curve of an Au contact heterojunction device under illumination by a 255 nm light source. (e) Responsivity and detectivity of the Au contacts under different bias voltages. (f) The external quantum efficiency (EQE) and photo-dark current ratio (PDCR). (g) I-V curve of a Bi-contact heterojunction device under illumination by a 255 nm light source, along with responsivity, detectivity (h), EQE and PDCR (i) under different bias voltages. (j) Photocurrent and dark current of the Bi-contact device under illumination by a 255 nm light source. (k) Fitted curve of the linear dynamic range. (l) Photo-dark current ratio (PDCR).
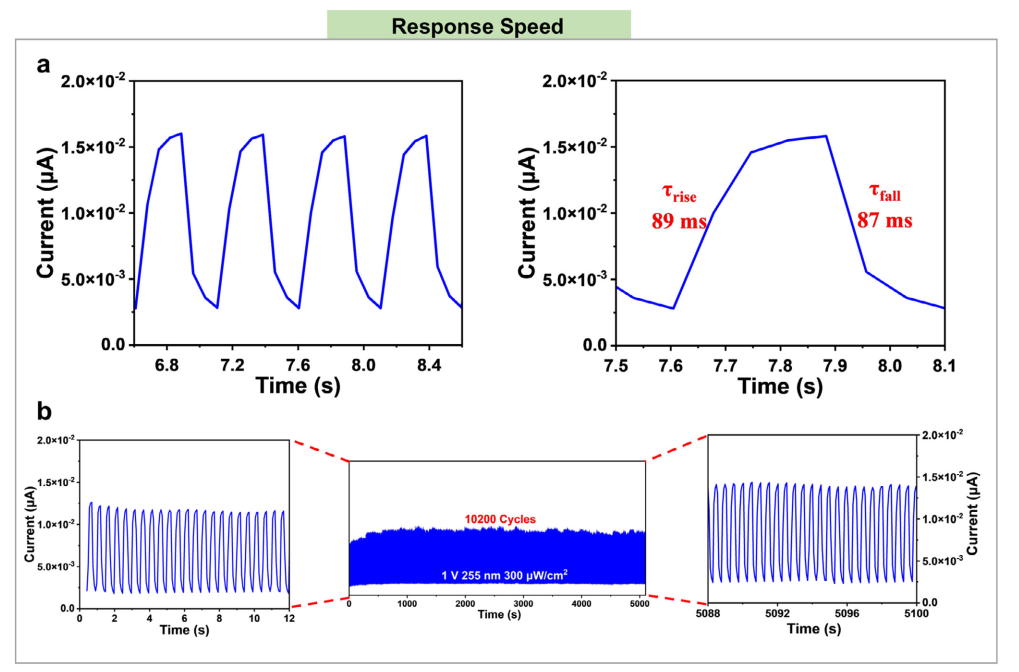
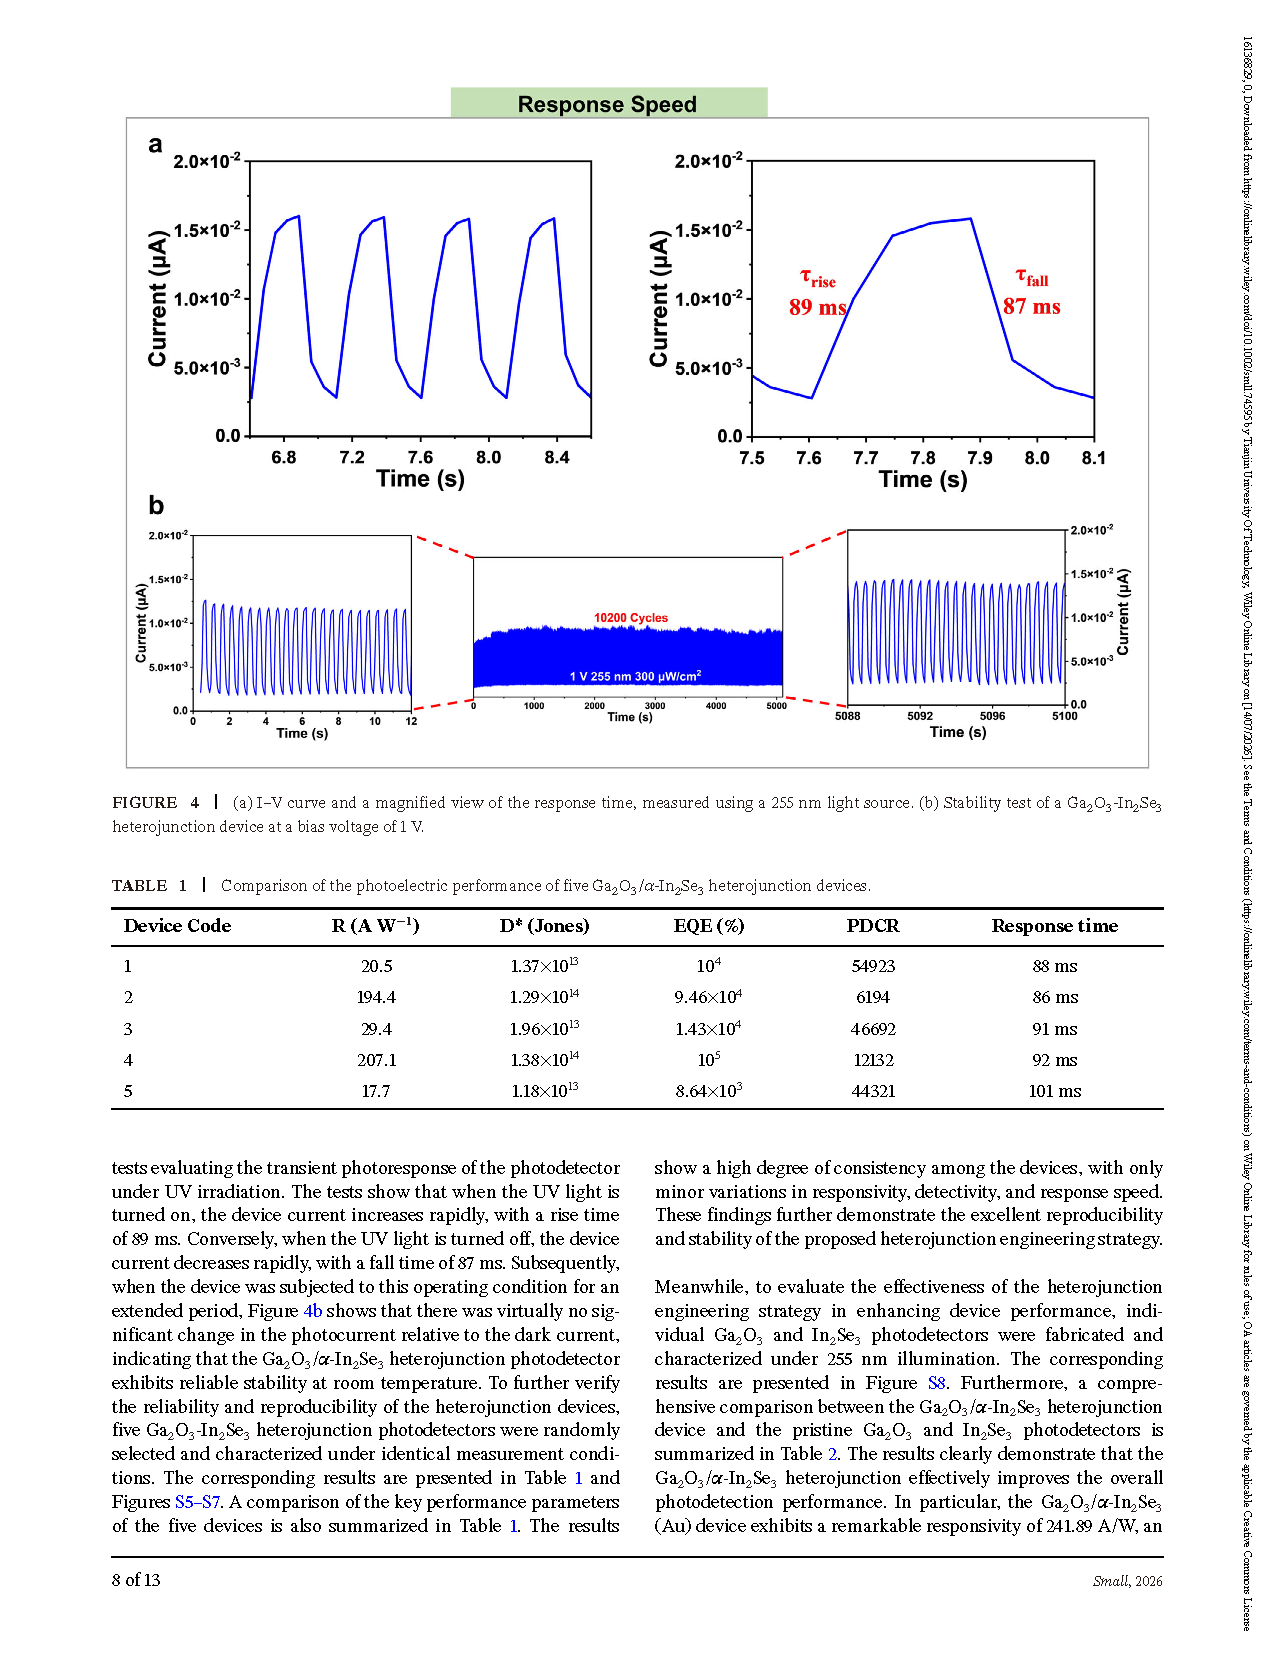
FIGURE 4 (a) I–V curve and a magnified view of the response time, measured using a 255 nm light source. (b) Stability test of a Ga₂O₃-In₂Se₃ heterojunction device at a bias voltage of 1 V.
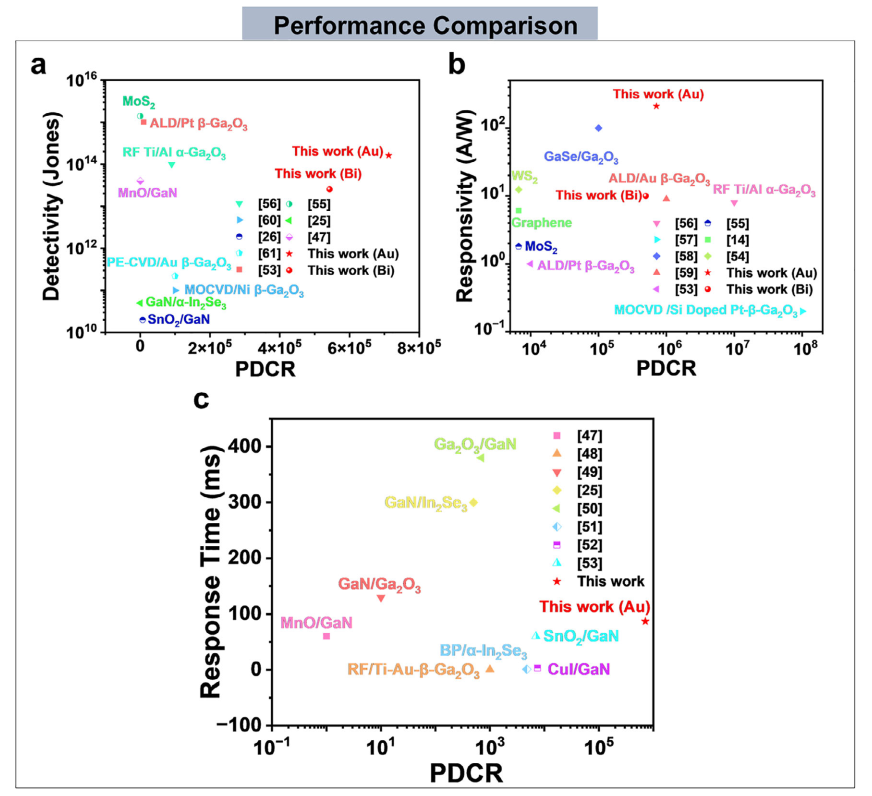
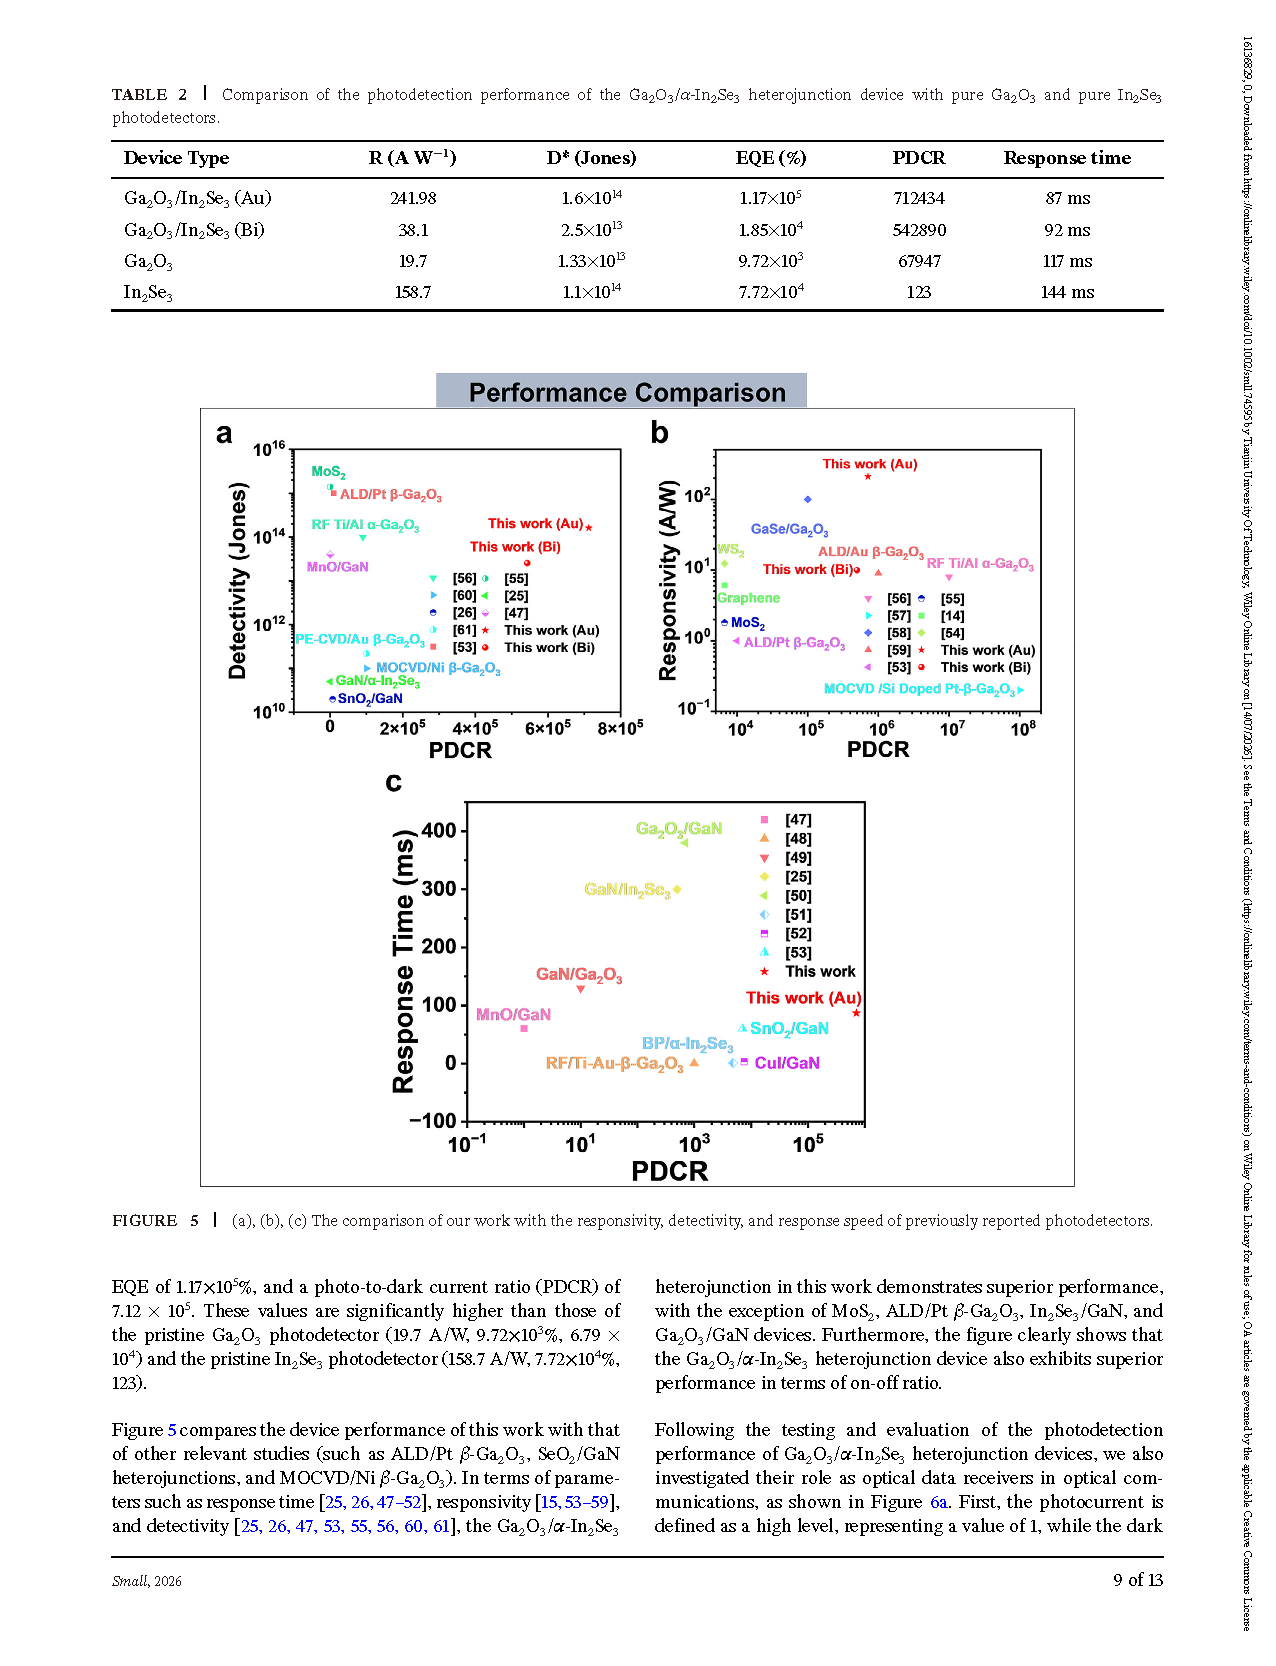
FIGURE 5 (a), (b), (c) The comparison of detectivity, responsivity, response speed with previously reported photodetectors.
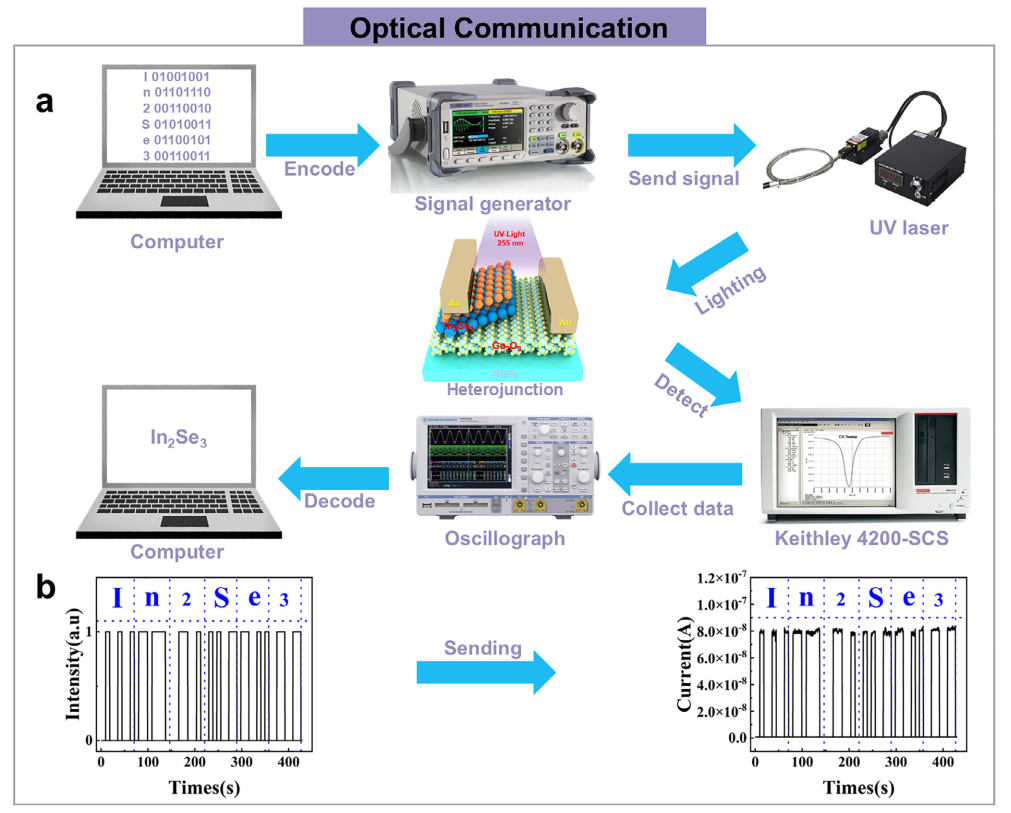
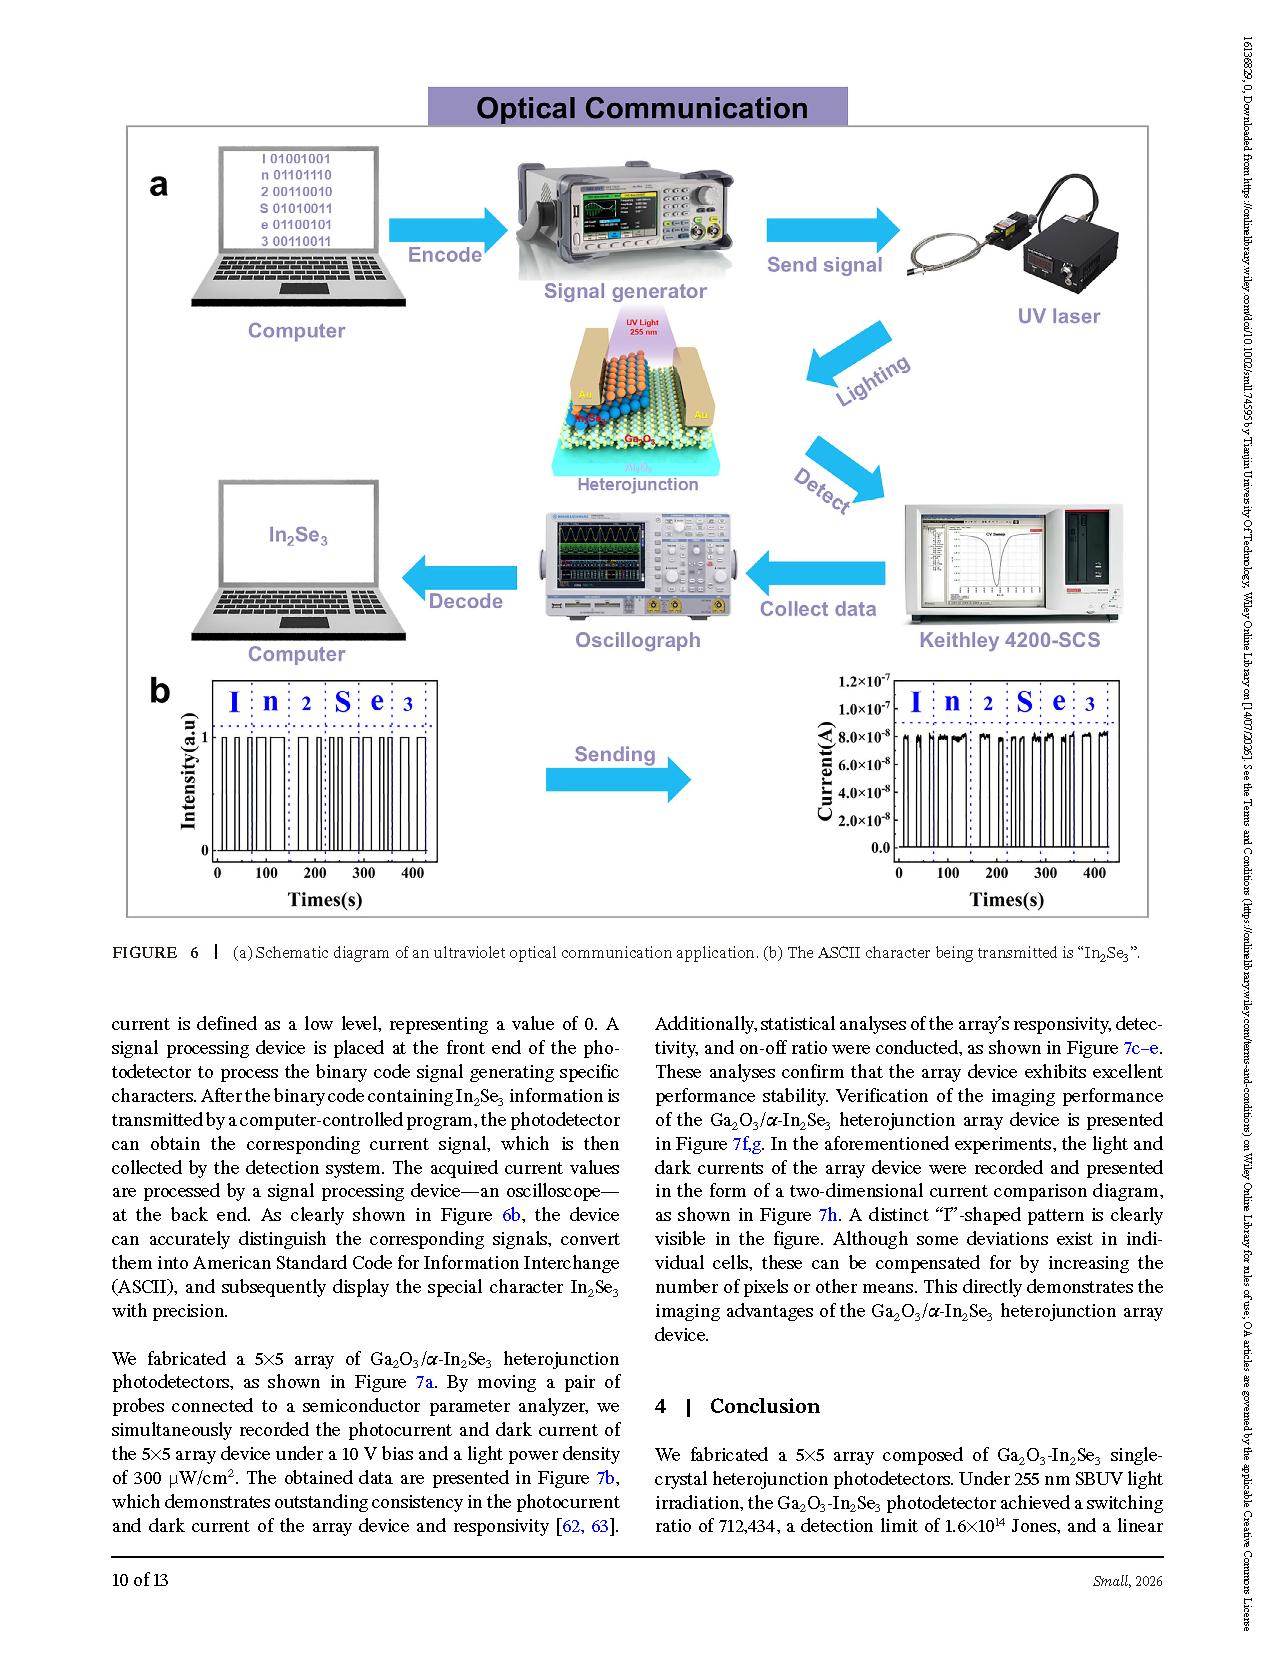
FIGURE 6 (a) Schematic diagram of an ultraviolet optical communication application. (b) The ASCII character being transmitted is “In₂Se₃”.
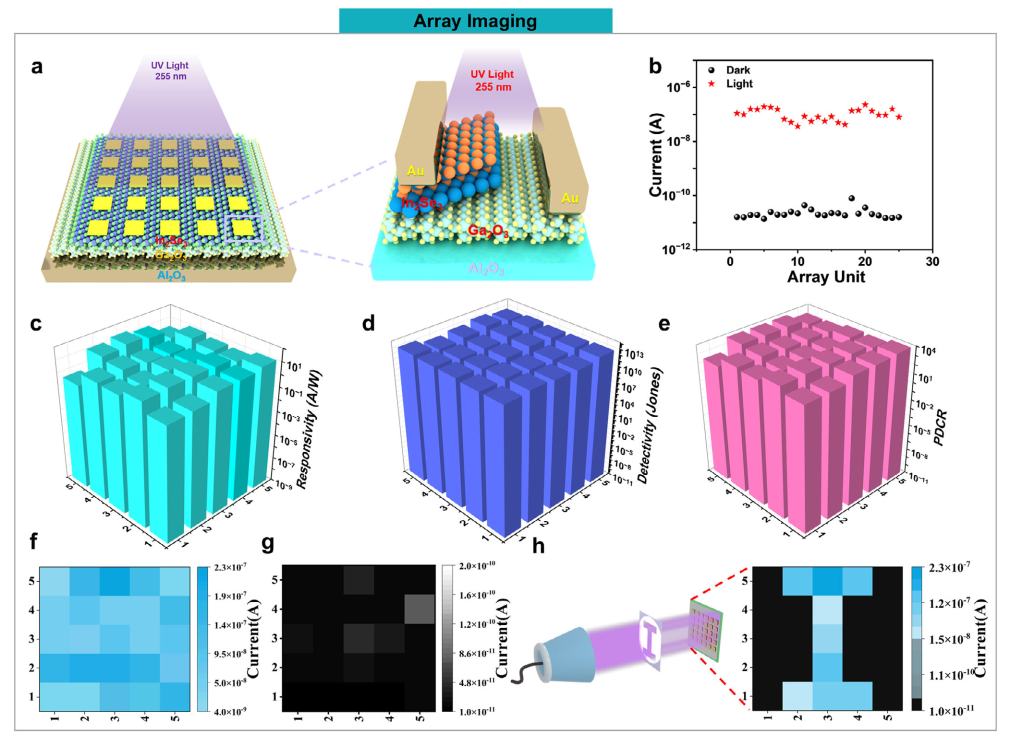
FIGURE 7 (a) A 5×5 array of Ga₂O₃ / α-In₂Se₃ heterojunction devices. (b) A statistical plot of the array’s photocurrent and dark current. (c), (d), and (e) show statistical plots of the array’s responsivity, detectivity, and on/off ratio, respectively. (f) An image of the array in the on state; (g) an image of the array in the off state. (h) The letter “I” imaging result obtained by array detection.
DOI:
doi.org/10.1002/smll.74595
Instruction
Official Account

Cooperation
Top